DbSchema Diagrams
What is a Diagram?
A diagram is the visual canvas of your DbSchema project. It displays tables and their relationships arranged the way you want, with optional notes and callouts. The same table can appear in more than one diagram, so you can create separate views for different audiences.
Everything — tables, positions, groups, notes, and virtual foreign keys — is saved in a single .dbs project file (XML format) that you can reopen at any time without a database connection.
Getting Your First Diagram
There are two ways to get started:
- Connect to reverse-engineer — DbSchema reads the schema from a live database and generates diagrams automatically, including tables and foreign key lines.
- Design offline — start from scratch without a database connection. Create tables freely, then sync to a database later.
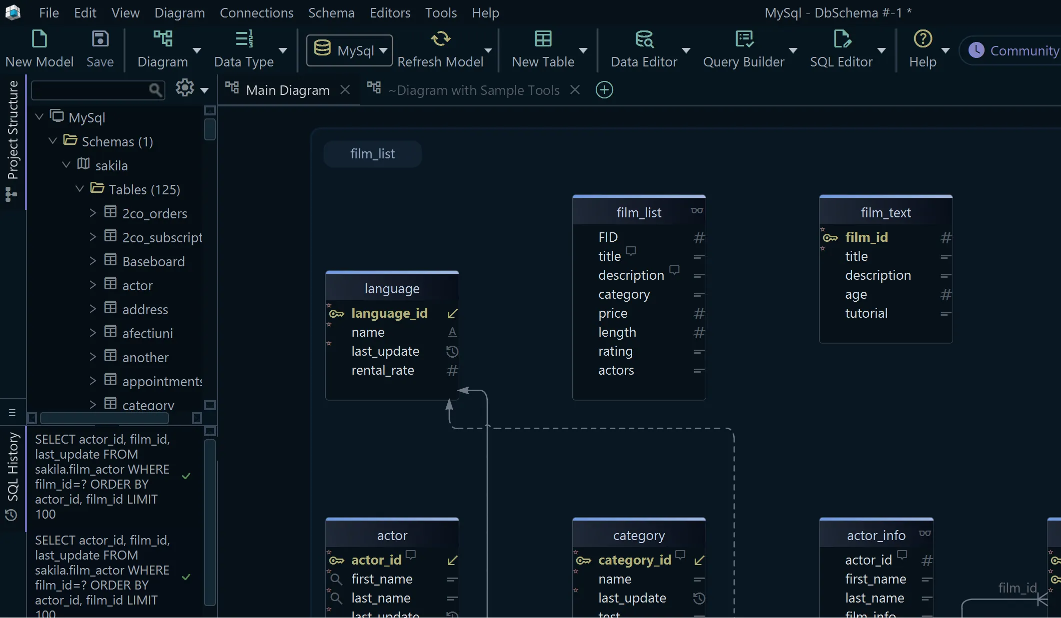
Tables on the Diagram
To create a table, right-click the empty canvas and choose New Table, or drag an existing table from the tree panel onto the diagram.
Double-click any table header to open the Table Dialog, where you can rename the table, add comments, and manage columns, indexes, and foreign keys.
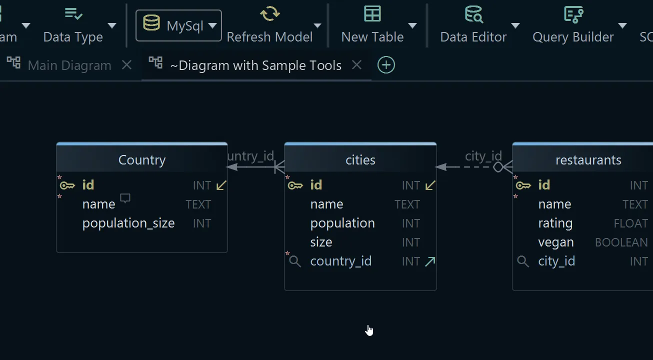
Showing Data Types
By default, the diagram shows column names and primary key markers. To also display data types next to each column, open the Diagram menu and enable Show Column Types.
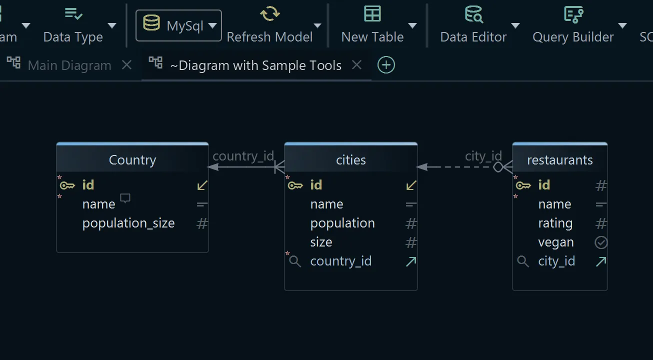
Relationships
Foreign key lines connect child tables to their parent tables. The arrow notation on each line indicates the cardinality (one-to-one, one-to-many). DbSchema supports several notations, switchable from the Diagram menu:
- Default — crow-foot symbols
- Barker — classic Barker ER notation
- Simple — plain lines
To create a foreign key, drag from a column in the child table to the target column in the parent table. The line appears immediately on the canvas.
Virtual foreign keys let you add a relationship that exists only in the project file — useful when the database does not enforce the FK or when linking views. They behave like regular FK lines for data browsing and query building, without modifying the database.
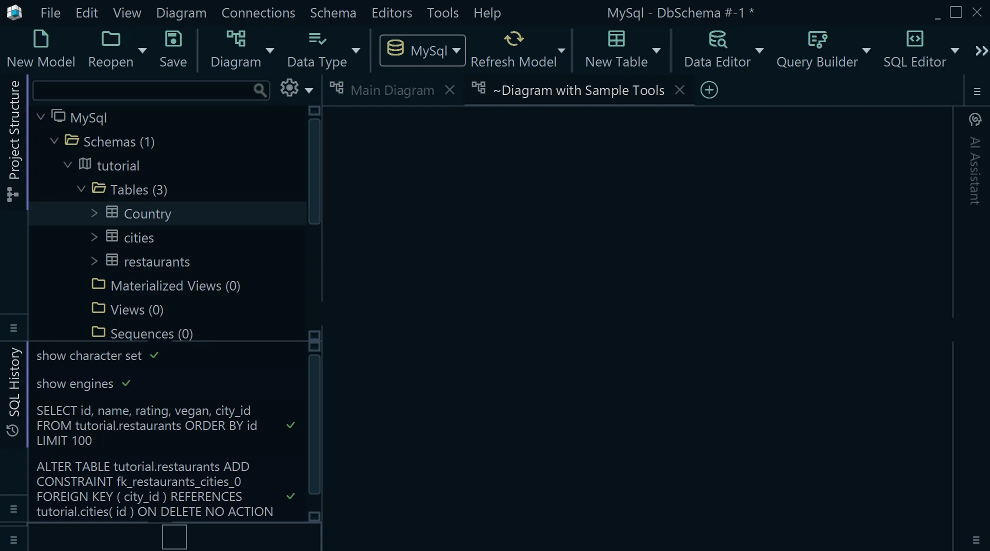
Multiple Diagrams per Project
A single DbSchema project can contain many diagrams. Use separate diagrams to focus on different subsystems — for example, Orders, Customers, and Reporting. Each diagram has its own layout and table visibility; the underlying schema definition is shared.
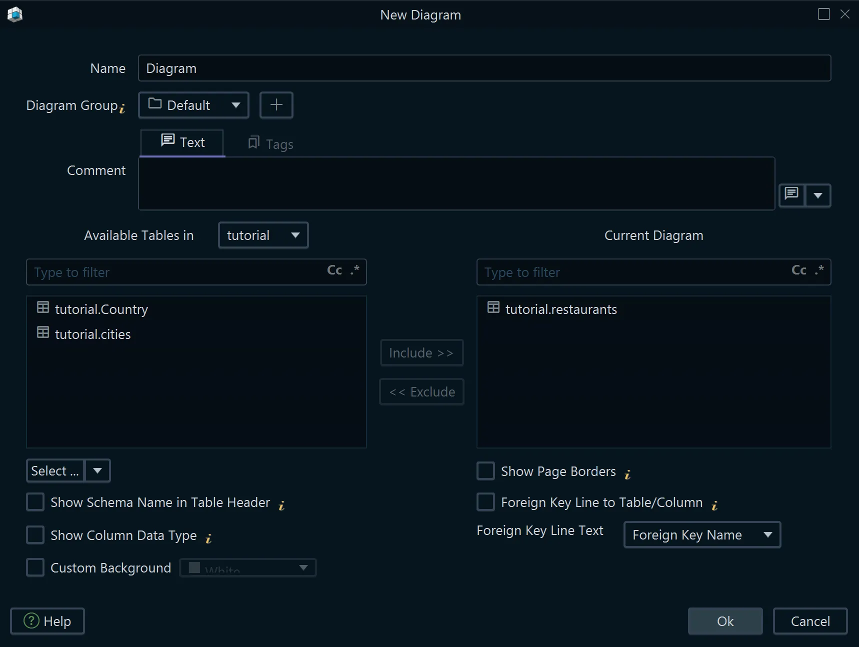
Add a new diagram from the Diagram menu or by clicking the + tab at the top of the diagram area.
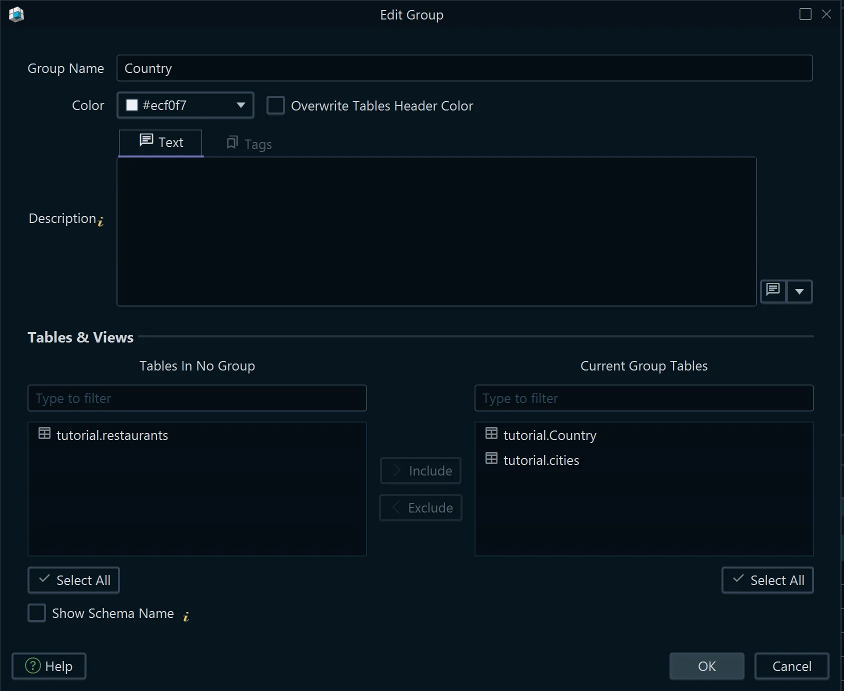
Grouping Tables
Related tables can be clustered into a named, colored group that you can move as a unit. This is especially useful for large schemas where tables belong to distinct modules.
Right-click the canvas and choose New Group, then drag tables into it. Alternatively, select several tables first and right-click to create a group from the selection.
Auto-Arrange
After reverse-engineering a large schema, tables often overlap. Select all tables (Ctrl+A) and choose Diagram → Auto Arrange to lay them out automatically using a graph algorithm. You can also drag individual tables and use snap guides for precise positioning.
Notes and Callouts
Add floating notes and callouts anywhere on the canvas from the Insert menu. Notes accept plain text and are saved in the project file; they also appear in generated HTML5 documentation.
Fast Data Browse
Hold Shift+Ctrl and click a table header to open the Relational Data Editor inline — a quick way to preview rows without leaving the diagram. The editor lets you filter, sort, and edit data directly.
Export
Share your diagrams in several formats from the File → Export menu:
- Image (PNG, SVG) — static snapshot of the current diagram
- PDF — printable, vector-quality output
- HTML5 — interactive documentation with searchable tables, column tooltips, and zoomable diagrams
- Markdown — embed schema references in documentation sites