Entity Relationship Diagram (ERD): Symbols, Examples, and How to Create One
For the person who has to read or draw a database diagram; keys, cardinality and the three notations are explained where they appear.
On this page
What an entity relationship diagram is
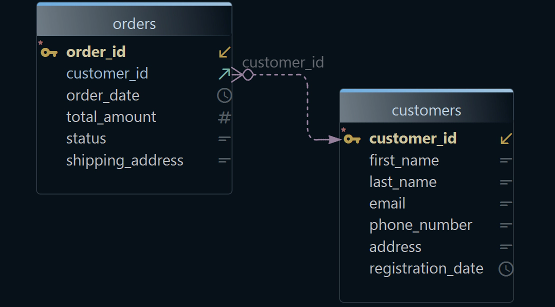
A database lands on you with sixty tables, no documentation, and a question about how orders reach customers. An entity relationship diagram answers it by drawing each table as a box, its columns as the rows inside that box, and each foreign key as a line between two boxes, with markers on the line ends saying whether one row or several sit on each side.
Five words carry the whole notation:
- An entity is a table, such as Customers or Orders.
- An attribute is a column, such as customer_id or email.
- The primary key is the column, or the set of columns, that identifies a row.
- A foreign key is a column that references another table's key.
- A relationship is the line those two keys create between the boxes.
If tables, columns, primary keys and foreign keys are already familiar, the rest of an ER diagram is notation on top of them.
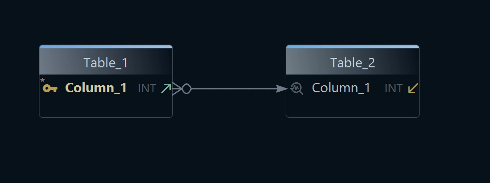
That makes an ER diagram worth drawing in two different situations: a design-first project, where the model is sketched before the database exists, and a documentation project, where an existing schema is reverse-engineered and explained to the rest of the team. If keys are the part that still feels loose, read Primary Key in SQL, What Is a Foreign Key? and the DbSchema page on foreign keys. For the modelling around the diagram, pair this with Steps to Design a Relational Schema and How to Design a Relational Database Schema.
How to read an ER diagram
Reading a diagram fast is a matter of order: the keys first, then the lines, then the exceptions.
| Visual cue | What to check | What it tells you |
|---|---|---|
| primary key columns | the identifier of each table | how rows are referenced |
| foreign key columns | the child-to-parent links | which table depends on which |
| junction tables | two foreign keys and little else | a many-to-many relationship |
| crow's foot or line endings | the markers at each line end | one-to-one against one-to-many |
| nullable foreign keys | whether the parent is required | whether the relationship is optional |
Start with the tables that anchor the domain, such as Customers, Orders or Invoices, then work outward to lookup tables, link tables and optional children. In the DbSchema diagram you can do that by clicking, since a table's foreign key lines lead to the tables it depends on, and the Diagram menu has Show Column Types for when the box names alone are not enough.
Cardinality in an ER diagram
Cardinality says whether one row or several on one side of a line can match a row on the other side. It is the one thing a diagram carries that a list of table names cannot.
One-to-one (1:1)
One row in the first table matches one row in the second. A Users table and a UserProfiles table are the usual case, split so that optional or sensitive columns live apart from the row every query touches. A unique constraint on the child's foreign key is what holds the pairing to a single row.
One-to-many (1:N)
One row in the parent matches several rows in the child: one customer, many orders. The foreign key sits on the child, and this is the shape most lines on a real diagram have.
Many-to-many (M:N)
Rows on both sides match several rows on the other, and no relational engine stores that directly. The relationship becomes a junction table holding one foreign key to each side, which is why such a pair is drawn as three boxes rather than two.
Common ERD symbols and notations
Three notations account for most diagrams you will be handed.
| Notation | Where it is used | What you see |
|---|---|---|
| Crow's Foot | database tools and working schemas | boxes, with cardinality markers on the line ends |
| Chen | teaching and conceptual modelling | entities, attributes and relationships as separate shapes |
| IDEF1X | formal data modelling | keys and identifying relationships carry the emphasis |
DbSchema draws crow's foot by default and switches the notation from "Diagram → FK Notation", which also offers Barker and UML, so a diagram can be redrawn in the notation the reader expects rather than the one it was created in.
The vocabulary around the symbols is smaller than it looks:
- A strong entity stands on its own.
- A weak entity depends on another entity for its identity, which is drawn as an identifying relationship.
- A derived attribute is calculated from other columns rather than stored.
- A multivalued attribute holds more than one value, and in a relational design it becomes a table of its own.
What matters in a review is not the symbol set but the dependency each line encodes: which table cannot exist without which.
Conceptual, logical, and physical ER diagrams
The same domain is drawn three times over the life of a project, at three levels of detail.
| Type | Focus | Contents | Used for |
|---|---|---|---|
| conceptual | the business view | entities and broad relationships | stakeholder workshops |
| logical | the design | entities, attributes, keys, normal forms | planning the database |
| physical | the implementation | tables, column types, indexes, constraints | deployment and reverse engineering |
Draw the conceptual diagram while the domain is still being argued about with people who do not write SQL, the logical one while the structure is being settled, and the physical one once the engine is chosen or the database already exists. The DbSchema logical design page covers the middle level, where entities and relations are still engine-neutral, and schema documentation covers publishing whichever level you end up with.
Entity relationship diagram example
A library schema is the shortest example that still needs a junction table:
CREATE TABLE Authors (
  author_id INT PRIMARY KEY,
  name      VARCHAR(120) NOT NULL
);

CREATE TABLE Books (
  book_id        INT PRIMARY KEY,
  title          VARCHAR(200) NOT NULL,
  published_year SMALLINT
);

CREATE TABLE BookAuthors (
  book_id   INT NOT NULL,
  author_id INT NOT NULL,
  PRIMARY KEY (book_id, author_id),
  FOREIGN KEY (book_id)   REFERENCES Books(book_id),
  FOREIGN KEY (author_id) REFERENCES Authors(author_id)
);

INSERT INTO Authors VALUES (1, 'Maria Vega'), (2, 'Tom Ellis');
INSERT INTO Books VALUES (10, 'Field Guide to Ferns', 2019);
INSERT INTO BookAuthors VALUES (10, 1), (10, 2);
BookAuthors exists because one book can have several authors and one author can write several books. Its primary key is both columns together, so the same pair cannot be inserted twice. The join that reads it returns one row per author of the book:
SELECT b.title, a.name
FROM Books b
JOIN BookAuthors ba ON ba.book_id = b.book_id
JOIN Authors a ON a.author_id = ba.author_id
ORDER BY a.name;
| title | name |
|---|---|
| Field Guide to Ferns | Maria Vega |
| Field Guide to Ferns | Tom Ellis |
On the diagram those three tables appear as three boxes with two lines, and the crow's foot markers land on the BookAuthors side of both lines.
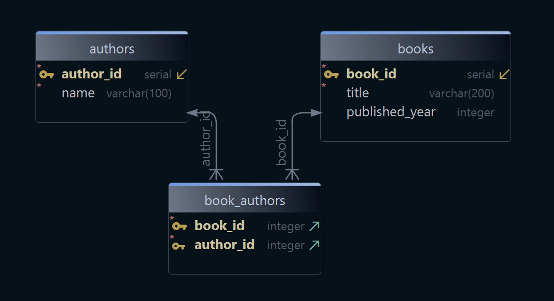
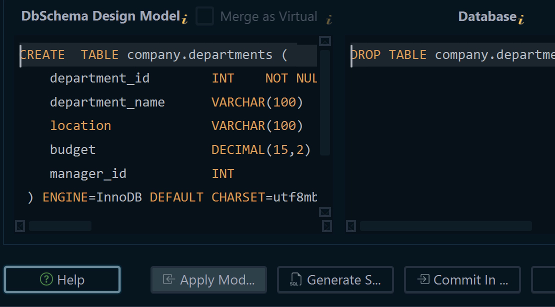
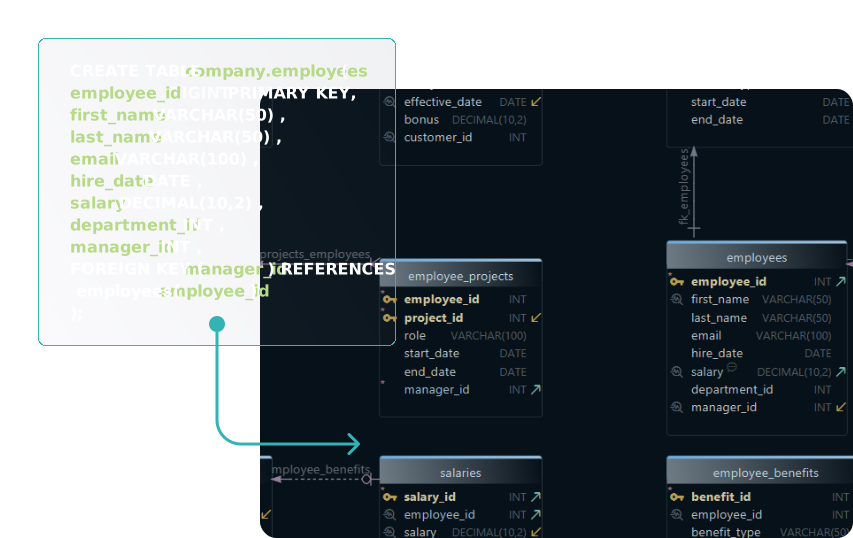
DbSchema can also build the picture from the script instead: Open SQL File on the welcome screen parses the DDL and draws the tables, columns and foreign keys it finds, so a schema that exists only as a file becomes a diagram without a database in the middle.
How to create an ER diagram step by step
Eight steps take a domain to a diagram somebody else can review.
- Name the entities, meaning the things the system stores, such as customers, products, invoices or tickets.
- List the attributes of each entity, keeping business data apart from lookup values.
- Choose a primary key per entity. A surrogate key is easier to live with than a business key that users can edit.
- Draw a foreign key wherever one entity depends on another.
- Mark the cardinality of every line, and turn each many-to-many into a junction table.
- Split repeating groups out into tables of their own, so no column holds a list.
- Run the application's most frequent queries against the drawing, and check that each one has a path of foreign keys to follow.
- Publish the diagram where the team will find it later.
Step 7 catches what the other seven cannot. A diagram that normalizes cleanly and still forces a five-table join for the screen users open every morning is a diagram worth changing before it becomes a schema. If the database already exists, connect to it and reverse-engineer the model instead of redrawing it by hand, then add the part no reverse engineering can read from a database, which is the comments saying what each column means.
ER diagram vs relational schema
The two words are searched for interchangeably and name different artefacts.
| ER diagram | Relational schema |
|---|---|
| the picture of entities and relationships | the definition of tables, columns, keys and constraints |
| read in design reviews and documentation | executed to create the database |
| understood by people who do not write SQL | precise enough for the engine |
The difference shows up in what the picture cannot hold. A line says that BookAuthors references Books, and it does not say what happens to those link rows when the book is deleted. That answer lives in the schema as a referential action, and in DbSchema you read it by double-clicking the relationship line to open the Foreign Key Editor, where the delete and update actions are set. Both views come from the same model, which is why the diagram and the generated DDL cannot disagree.
Create ER diagrams in DbSchema
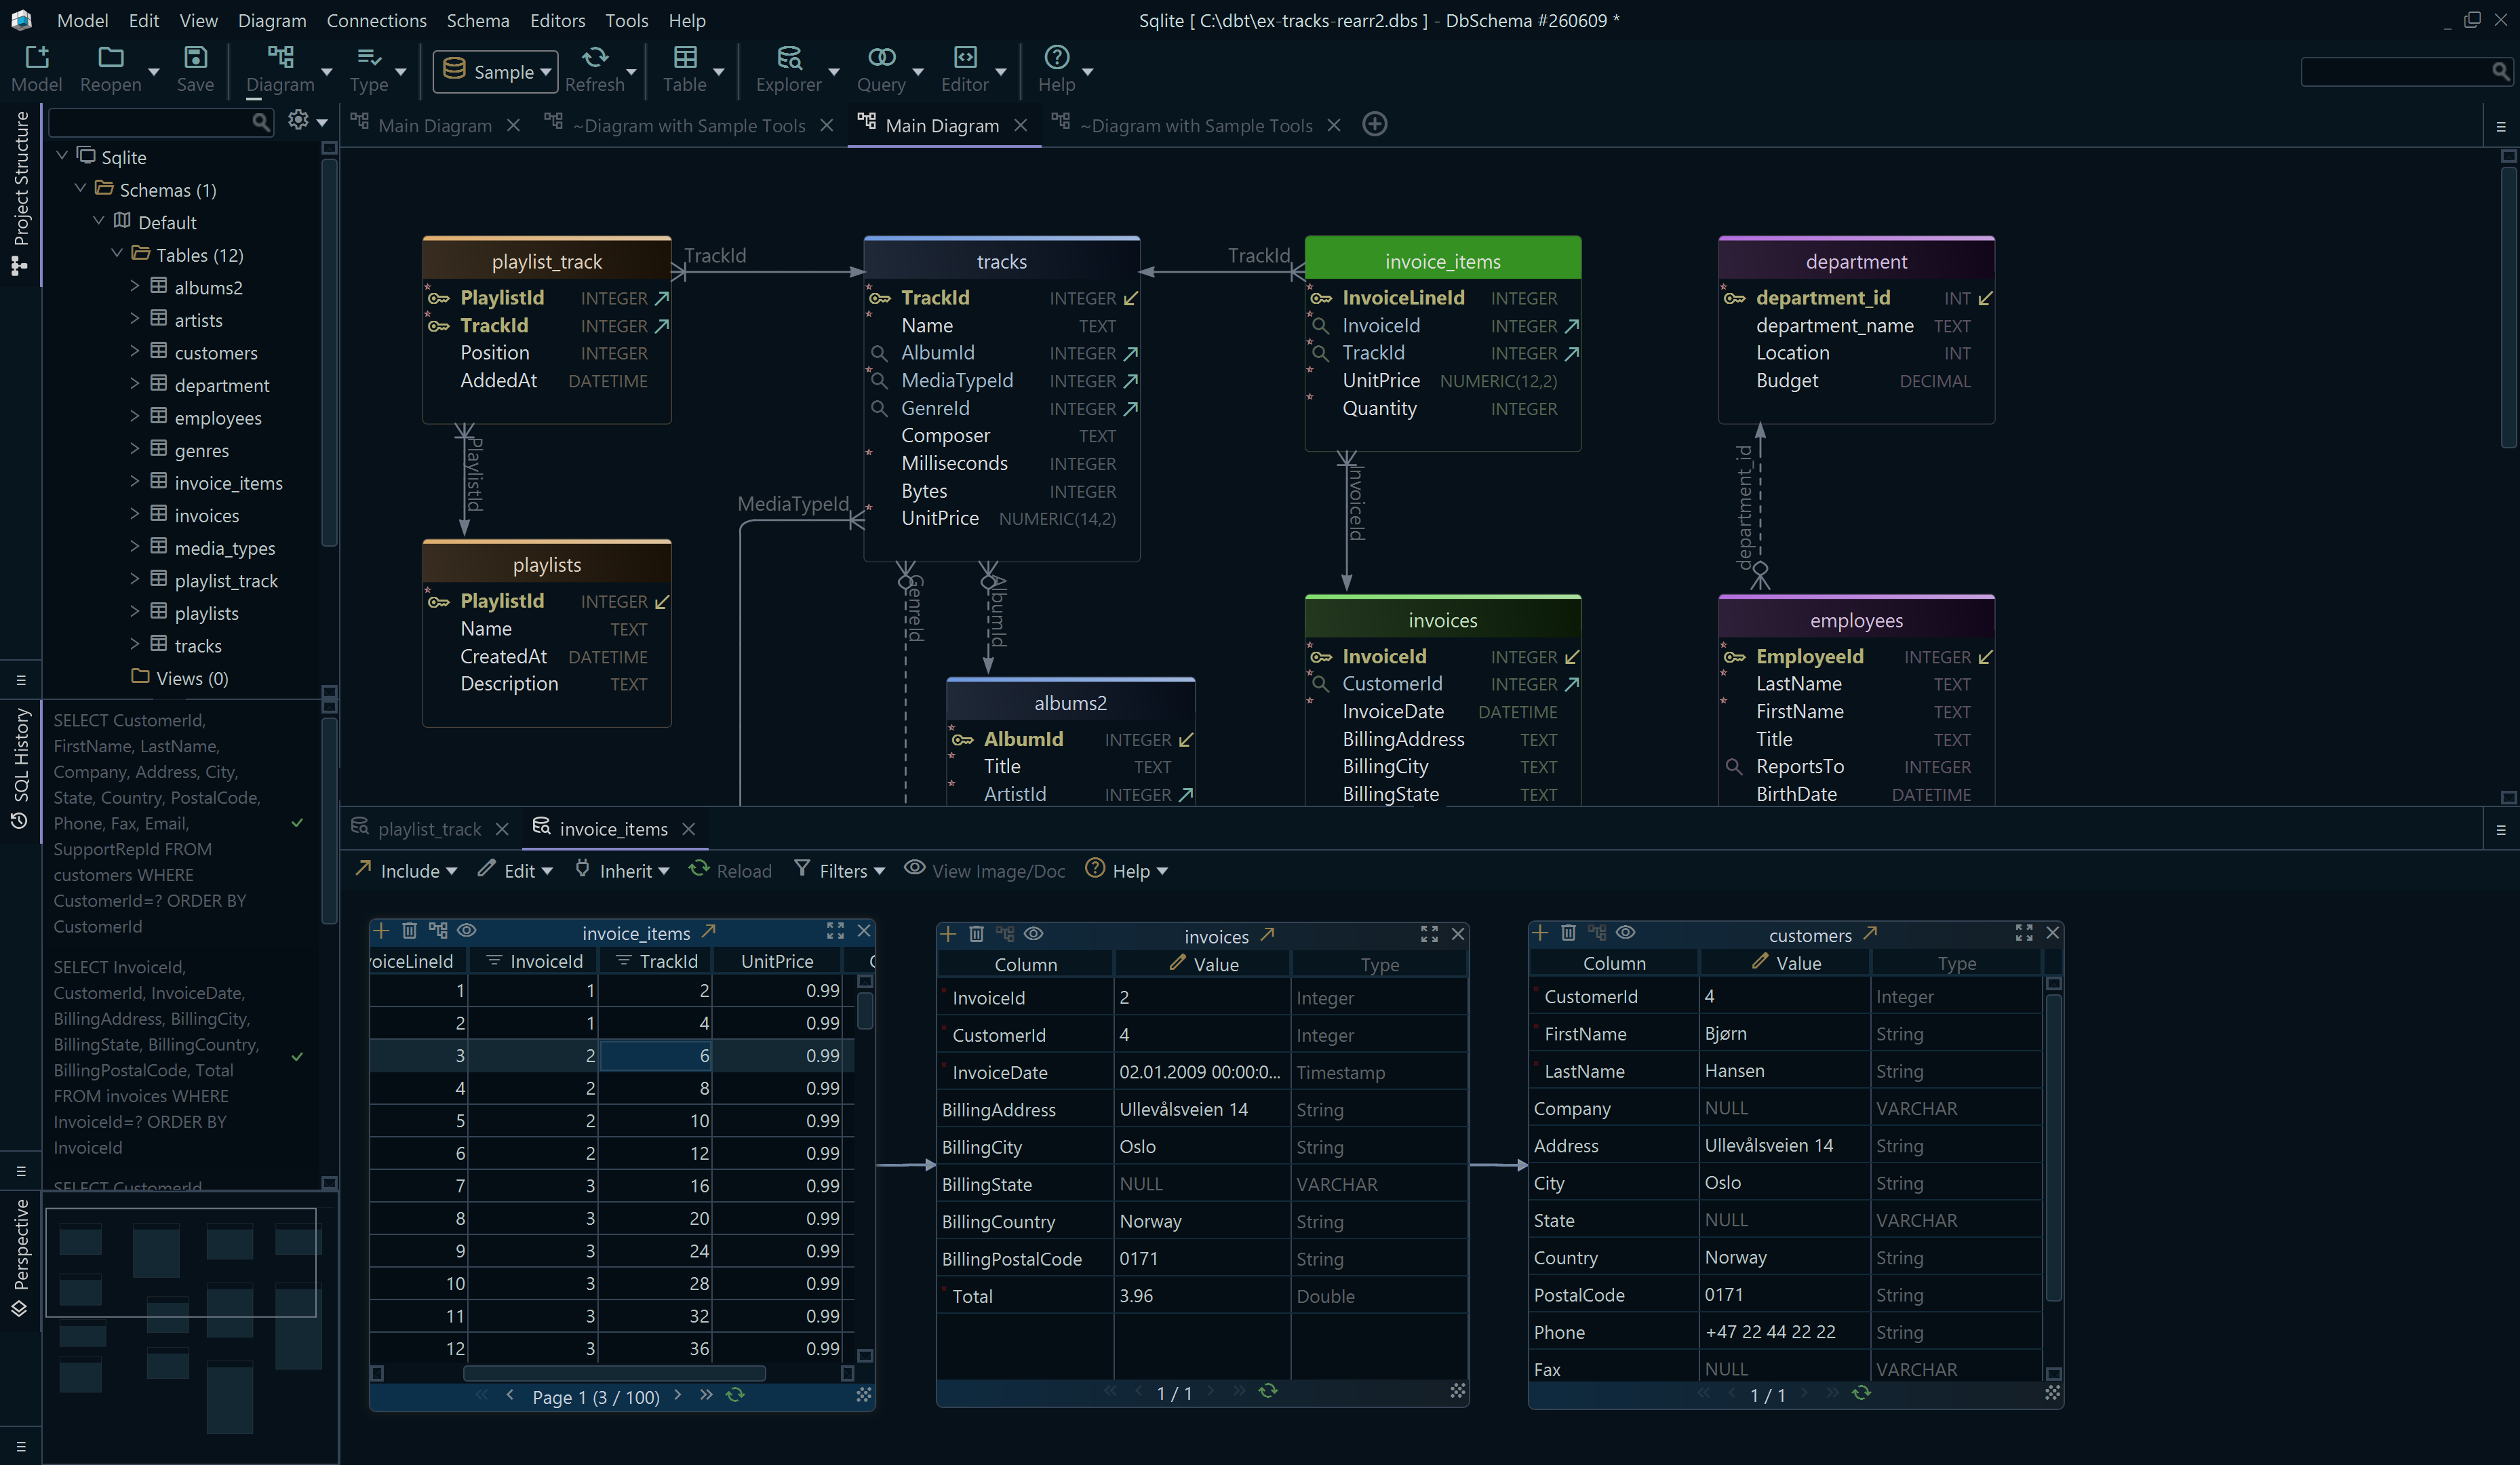
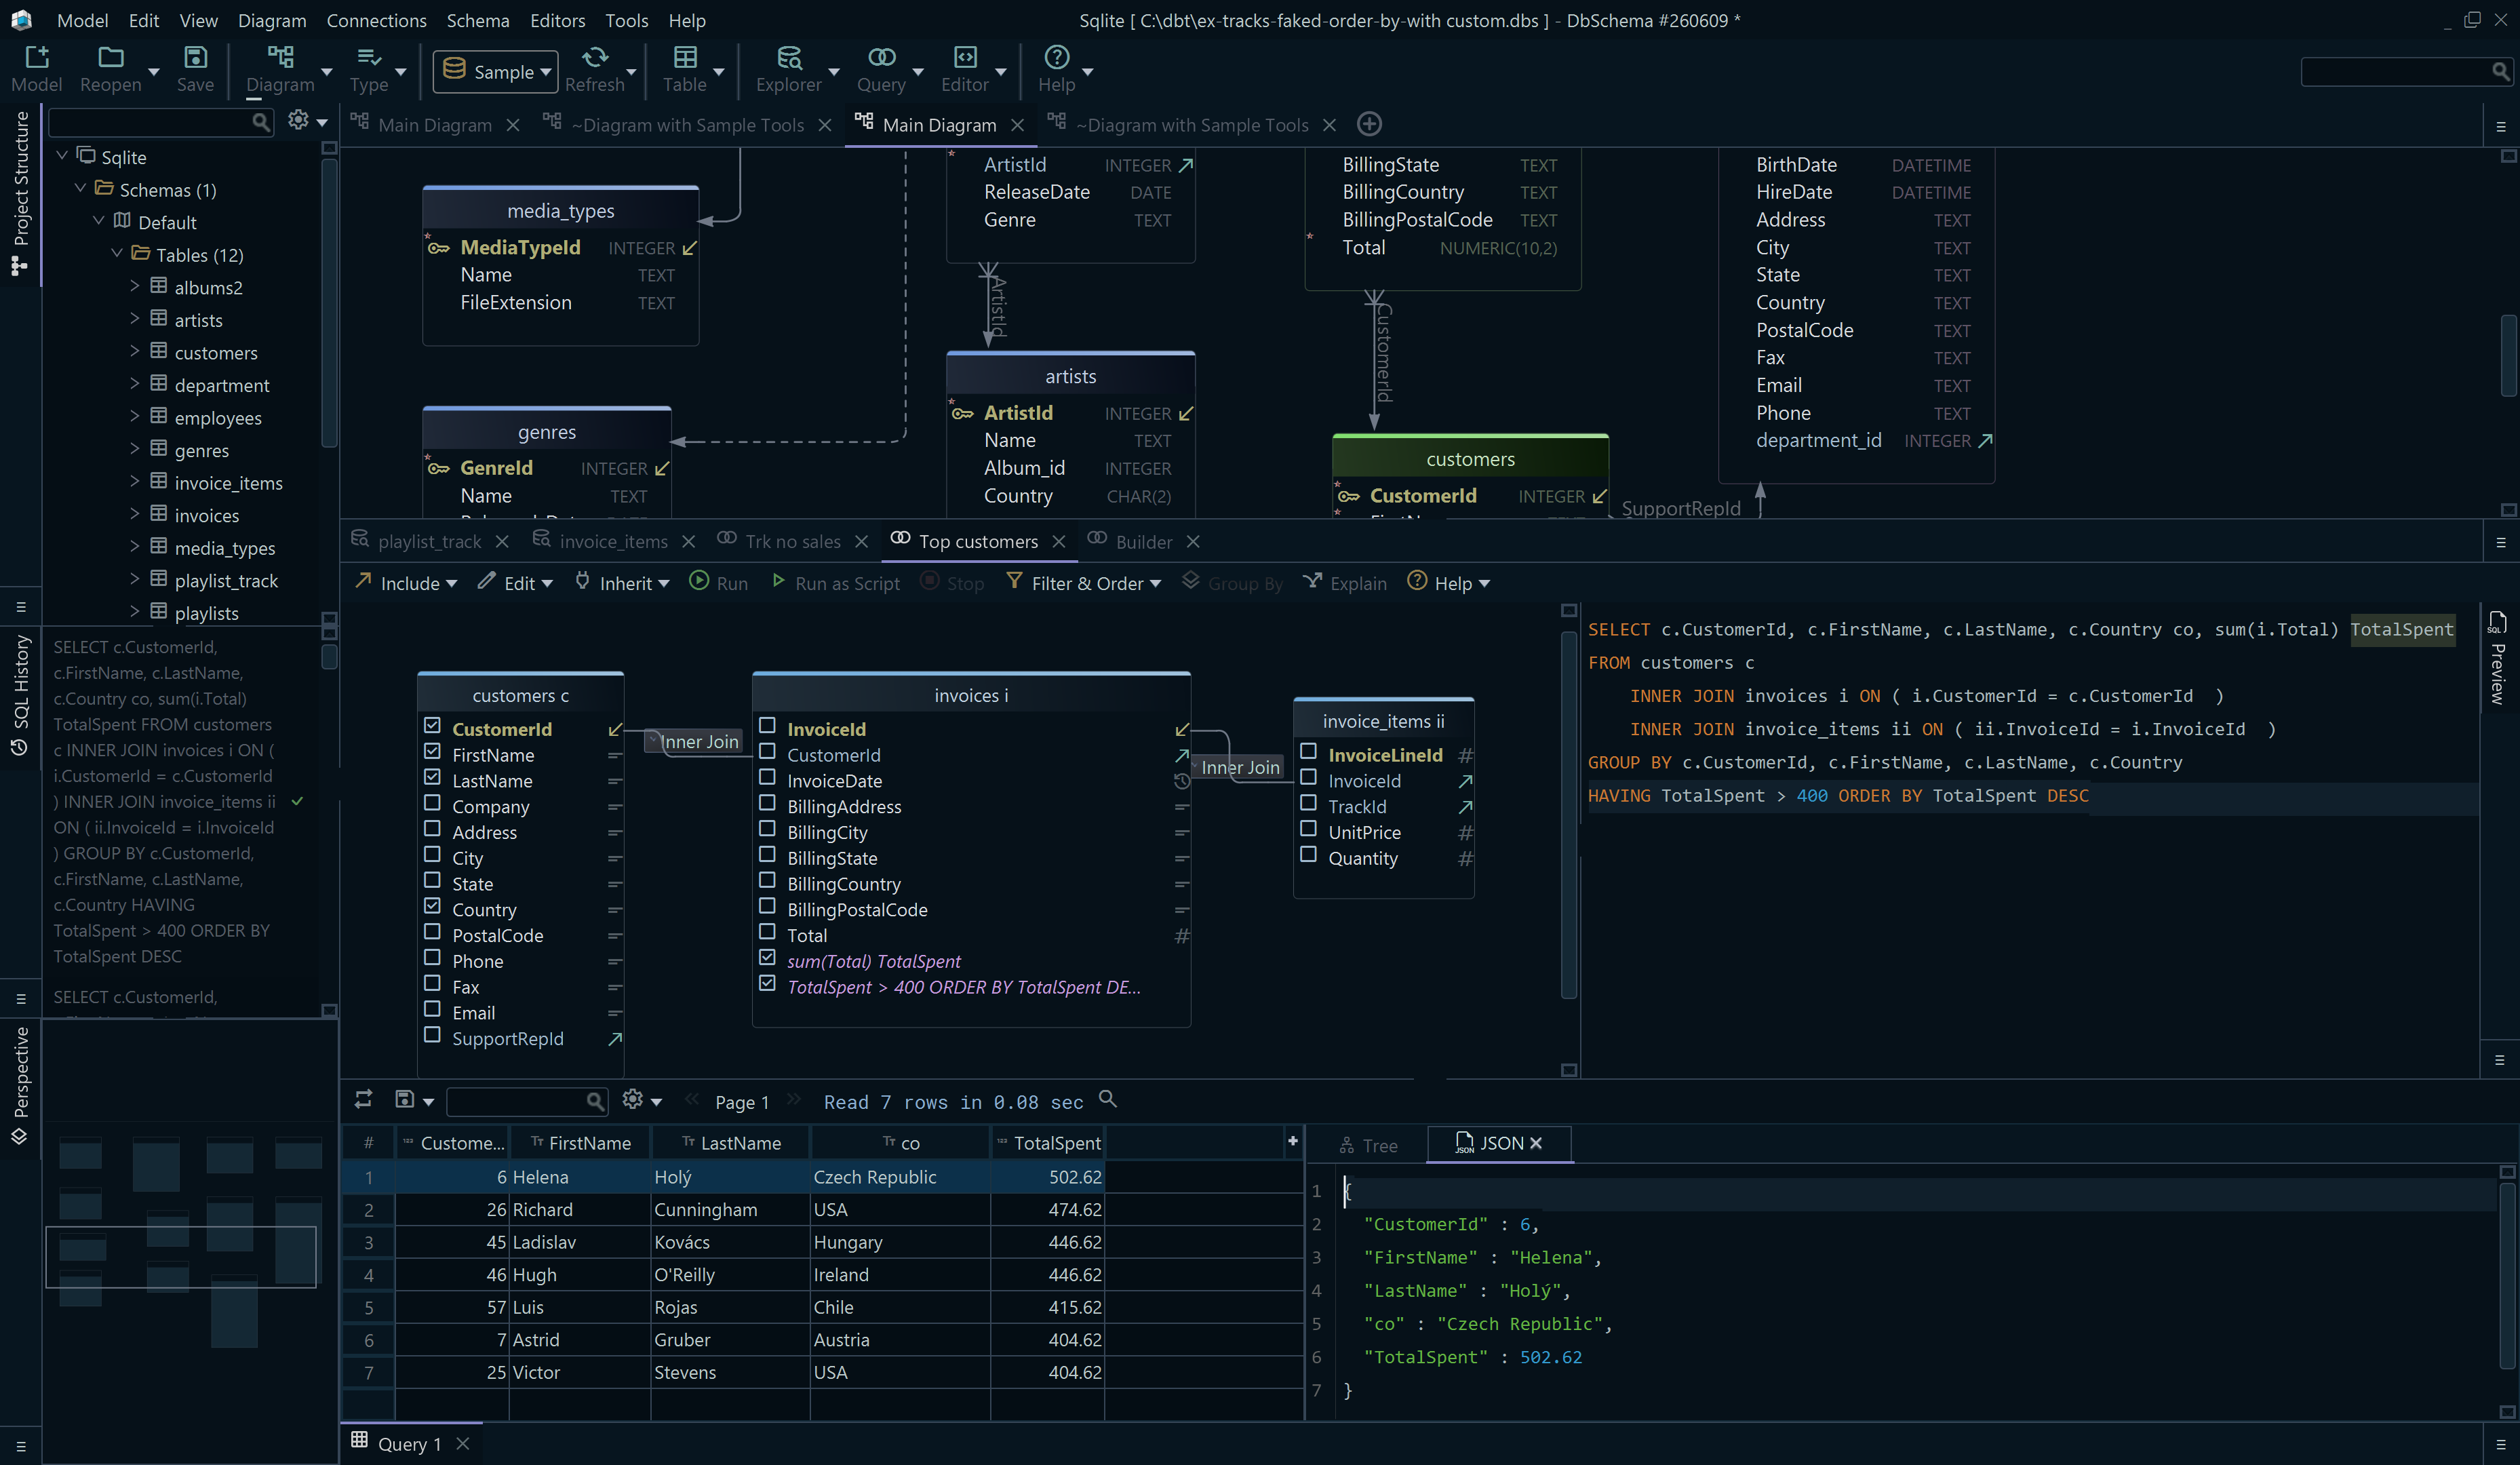

Five capabilities decide whether a diagram survives contact with a real project, and each one has a specific action behind it in DbSchema.
| Capability | Why it matters | In DbSchema |
|---|---|---|
| visual design | mistakes are cheaper on a canvas than in DDL | draw tables and lines, then generate the SQL |
| reverse engineering | an existing database needs no redrawing | connect through JDBC and read the schema in |
| documentation export | the diagram outlives the meeting | publish HTML5, PDF or Markdown |
| schema synchronization | the model and the database drift apart | compare them and generate the difference |
| several diagrams per model | a large schema does not fit on one page | one diagram per subsystem, one model underneath |
Two routes lead into that model. Drawing first, you build the tables in DbSchema: right-click the canvas, choose New Table, add the columns, then drag from a column to the column it references to create the foreign key. DbSchema generates the SQL for the engine you target. Starting from a database instead, you connect through a driver such as the PostgreSQL JDBC driver or the MySQL JDBC driver, and DbSchema reverse-engineers the schema and lays the diagram out for you.
Where the edits land depends on the connection. Connected, DbSchema applies each schema change to the database as you make it and lists the statements it ran in the SQL History pane. Disconnected, the same edits are saved only to the .dbs model file; on reconnecting you click Refresh Model from Database and review each difference in the synchronization dialog, choosing per object whether to write it to the database, pull it into the model, or put it in a migration script. Connecting, reverse-engineering, the diagrams and the SQL editor are in the free Community edition; saving the model to a file, the HTML5 documentation and schema synchronization are in Pro.
For database-specific walkthroughs, see Create ER Diagrams for MySQL and Create ER Diagrams for PostgreSQL. For the tools compared side by side, read Top Free Tools for Database Design, Best MySQL Database Design Tools and Top Free ER Diagram Tools for PostgreSQL.
Common ERD mistakes
Five things make a diagram mislead the person reading it:
- a table with no primary key
- a relationship line with no cardinality markers
- business concepts in one corner and index names in the other
- an identifier that encodes a branch code, a year and a sequence number
- a diagram that stopped matching the database
The first two make the lines unreadable. Nothing says which row a foreign key points at, and nothing says whether an order holds several items or an item belongs to several orders. A diagram that mixes levels serves neither the workshop nor the deployment, which is what the conceptual, logical and physical split exists to prevent. An encoded identifier has to be reissued the day the branch closes, and every child row carries the old value.
The last one is not a drawing mistake at all. A stale diagram is worse than no diagram, since the reader trusts it and it is wrong. Regenerating it from the database, rather than redrawing it by hand, is what keeps that from happening.
Open a database you already run and let it draw itself: the boxes, the keys and the lines are the schema you have, and the first thing worth looking at is which lines are missing. Download DbSchema at https://dbschema.com/download.html and connect: reverse-engineering, the interactive diagram and the SQL editor are in the free Community edition, and the HTML5 documentation that turns the diagram into something the team can read is in Pro.
FAQ
What is the difference between an ER diagram and a UML class diagram?
An ER diagram describes stored data: tables, columns, keys and the relationships between them. A UML class diagram describes software objects, including their behaviour, so it carries methods and inheritance that have no equivalent in a relational schema.
How do I create an ER diagram from an existing database?
Connect to the database and reverse-engineer it. In DbSchema you enter the host, port and credentials in the connection dialog, and DbSchema reads the tables, columns and foreign keys and lays them out as a diagram you can rearrange.
Can an ER diagram be exported as documentation?
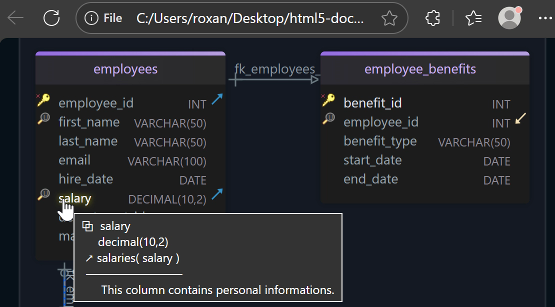
DbSchema exports it in three formats. The dialog behind "Diagram → Export HTML5 or PDF Documentation" offers HTML5, PDF or Markdown under Format, and in the HTML5 output the table and column descriptions appear as mouse-over tooltips over a vector diagram. Documentation export is in the Pro edition.
What if the database has no foreign keys to draw?
Create virtual foreign keys by dragging one column onto the related column in the DbSchema diagram. They are saved in the model file rather than in the database, so no constraint is created, and the diagram, the Query Builder and the Relational Data Editor treat them as relationships.
Draw the ER diagram from your own database
DbSchema reads the catalog over a JDBC connection and lays the tables and foreign keys out as an interactive diagram. Community Edition is free, with no table limit.