ER Diagram Tools for Large Schemas
For the architect whose schema runs to hundreds of tables and needs a diagram that stays readable and stays in step with the database.
On this page
Put four hundred tables on one canvas and you get a picture nobody reads; redraw it by hand after every release and you get one nobody trusts either. DbSchema is built for a schema that size. It reverse-engineers the live database over JDBC, spreads the tables across as many diagrams as the schema has subject areas, keeps all of them in one model file you commit to Git, and exports interactive HTML5 documentation from that file. Three other tools show up on the same search, and each is built around a different idea of where the diagram comes from: dbdiagram.io from DBML you type, DrawSQL from a browser canvas your team edits together, and Lucidchart from a general drawing surface.
Which tool is best for an ER diagram?
DbSchema, once the schema is past the size where one person holds it in their head. The reason is the direction the data travels. DbSchema connects to the database and reads the tables, columns, data types, primary keys and foreign keys itself, so the diagram is drawn from what is actually deployed rather than from what somebody typed. The other three start from a description you maintain: DBML in dbdiagram.io, shapes in Lucidchart, a browser canvas in DrawSQL. On a schema of forty tables that difference is a morning's transcription. On a schema of four hundred it decides whether the diagram is ever accurate again.
The second reason is what happens to the picture afterwards. DbSchema holds the diagrams, the table positions, the groups, the notes and the virtual foreign keys in one .dbs model file, which is plain XML, so a schema change reads as added and removed lines in a pull request. Everything you do on the canvas changes that file and nothing else; the database changes only when you run a synchronization against it.
How can I generate an ER diagram?
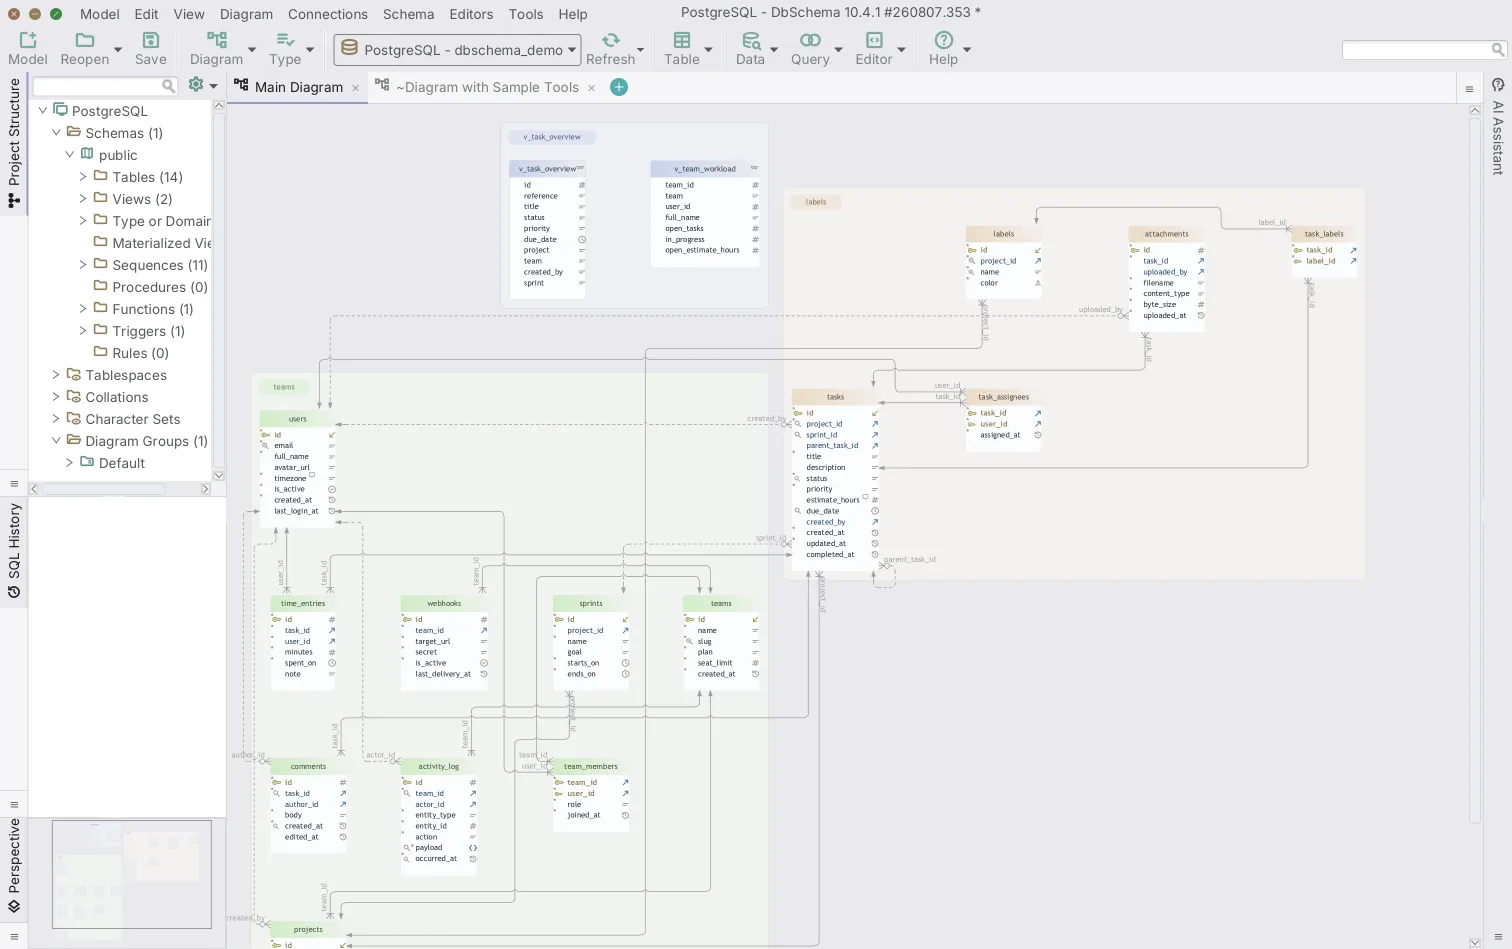
Two routes exist, and they differ in who does the typing. Reverse-engineering connects to a live or staging database over a JDBC driver and reads the catalog: DbSchema pulls in tables, columns, indexes, primary keys and foreign keys in one pass and draws them, with no transcription step in between. Text-to-diagram platforms take the other route. dbdiagram.io's editor takes DBML, which its own pricing page lists as an open schema spec included on every plan[1], so a schema arrives either as pasted DDL or as DBML somebody writes.
For a schema of a few dozen tables both routes finish in an afternoon. Past that, the pasted-DDL route has to be repeated after every release, because the text file has no link back to the server it describes.
From a live database, or from code you write
| Step | JDBC reverse-engineering in DbSchema | DBML or pasted DDL |
|---|---|---|
| Where the schema comes from | The live database, over a JDBC driver | Text you paste or type |
| Keeping it current | Refresh from the database | Repeat the paste |
| Where it runs | Desktop application | Browser editor |
Reverse-engineering also brings in what hand-written markup usually leaves out. Vendor-specific data types, index definitions and the foreign keys the database actually enforces come across as they are, because DbSchema reads them from the catalog rather than from a description of it. For a walkthrough on the schema sizes this article is about, see handling large schemas.
Can ChatGPT create a diagram?
A large language model can turn pasted DDL into Mermaid or PlantUML markup, and for a handful of tables that renders a usable picture inside a Markdown viewer. The limit is not the model's drawing ability. It is that the markup it produces has no connection to the database, so nothing pulls the tables back in when the schema changes, and nobody can tell by looking whether the diagram matches production or last quarter.
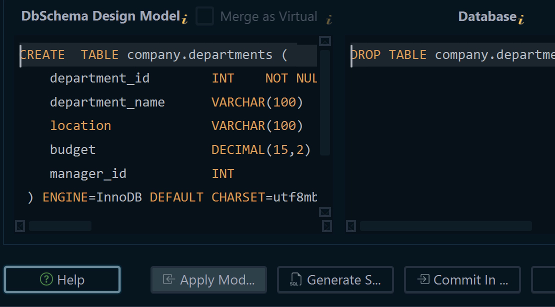
DbSchema closes that loop from the other end. The diagram comes from a connection, and when the database moves ahead of the model, Schema → Compare Model with Database lists what differs object by object and you decide per difference whether to update the model or push the change to the database. That comparison is what turns a diagram into something you can trust in a design review. Schema synchronization is a Pro feature.
What are common ER diagram mistakes?
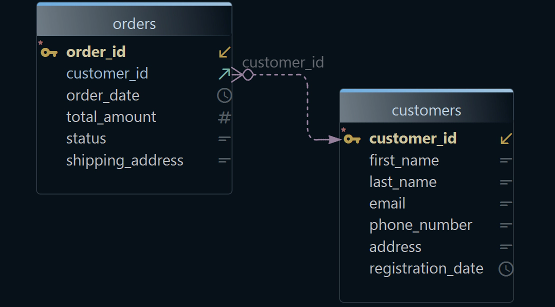
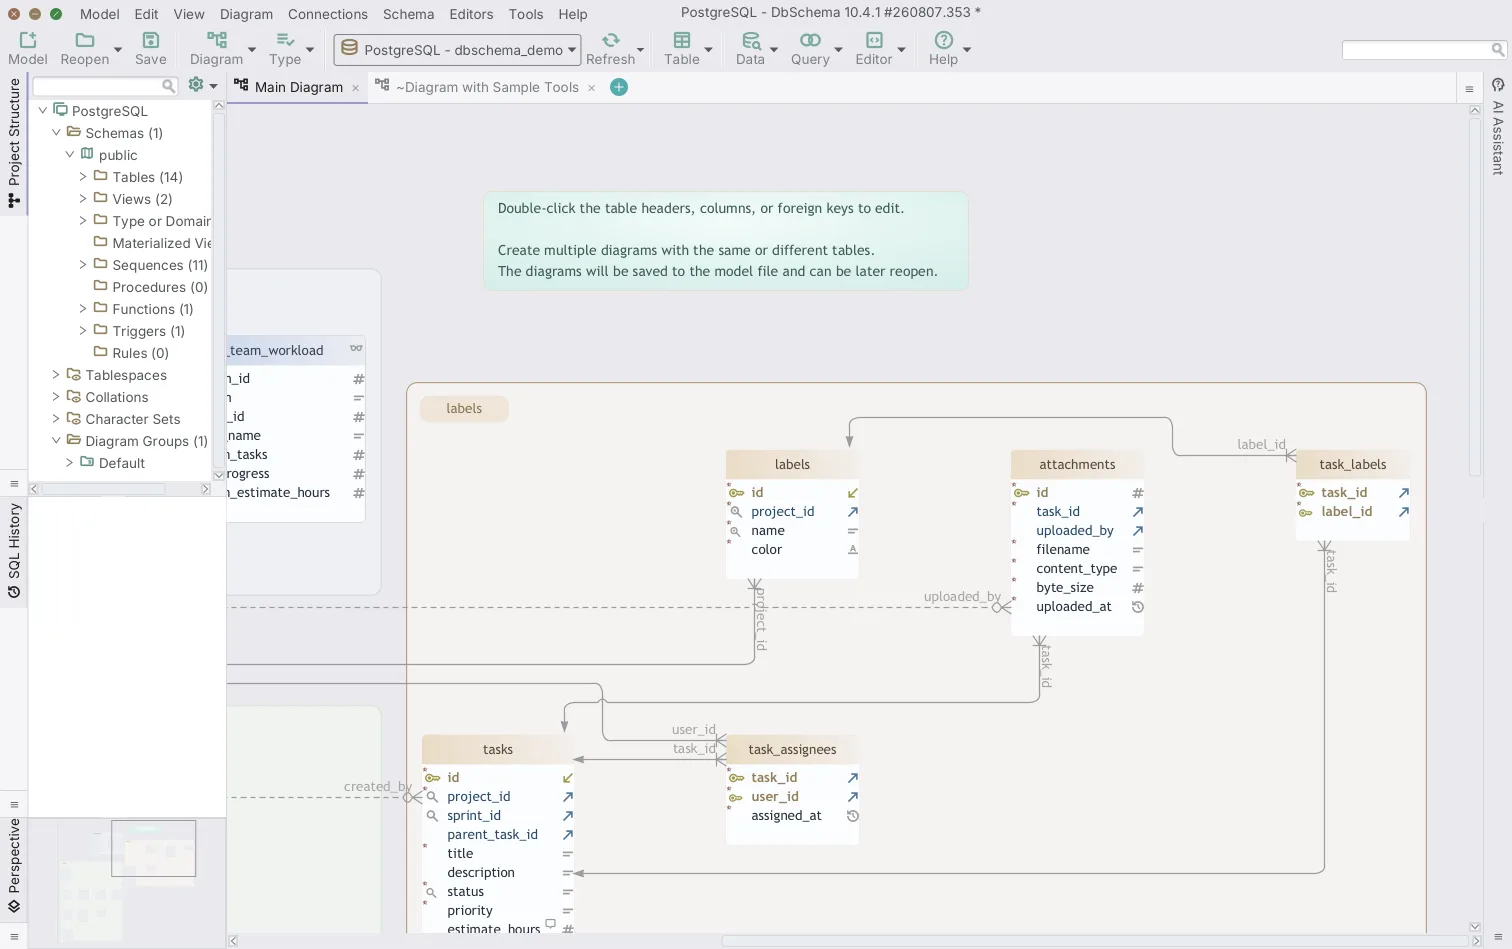
The first is putting every table on one canvas. A hundred tables in one view is a mesh of crossing relationship lines in which no domain is legible, and the fix is not a bigger screen. Split the schema by subject area instead, one diagram for billing, one for authentication, one for inventory. DbSchema keeps several diagrams in one model: add a diagram from the Diagram menu, drag in the tables that belong to it, and the same table can appear on more than one without being duplicated in the schema. Grouping helps inside a single diagram too, with New Group on the canvas.
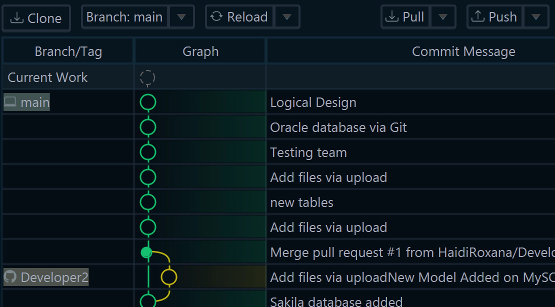
The second is treating the diagram as a picture. A PNG in a wiki cannot be diffed, reviewed or merged, so it drifts from the day it is exported. A model file can: DbSchema's .dbs is XML holding the schema plus every layout, group, colour and comment, and committing it to Git puts schema changes through the same pull requests as the application code.
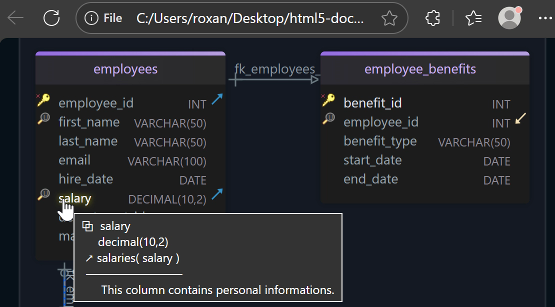
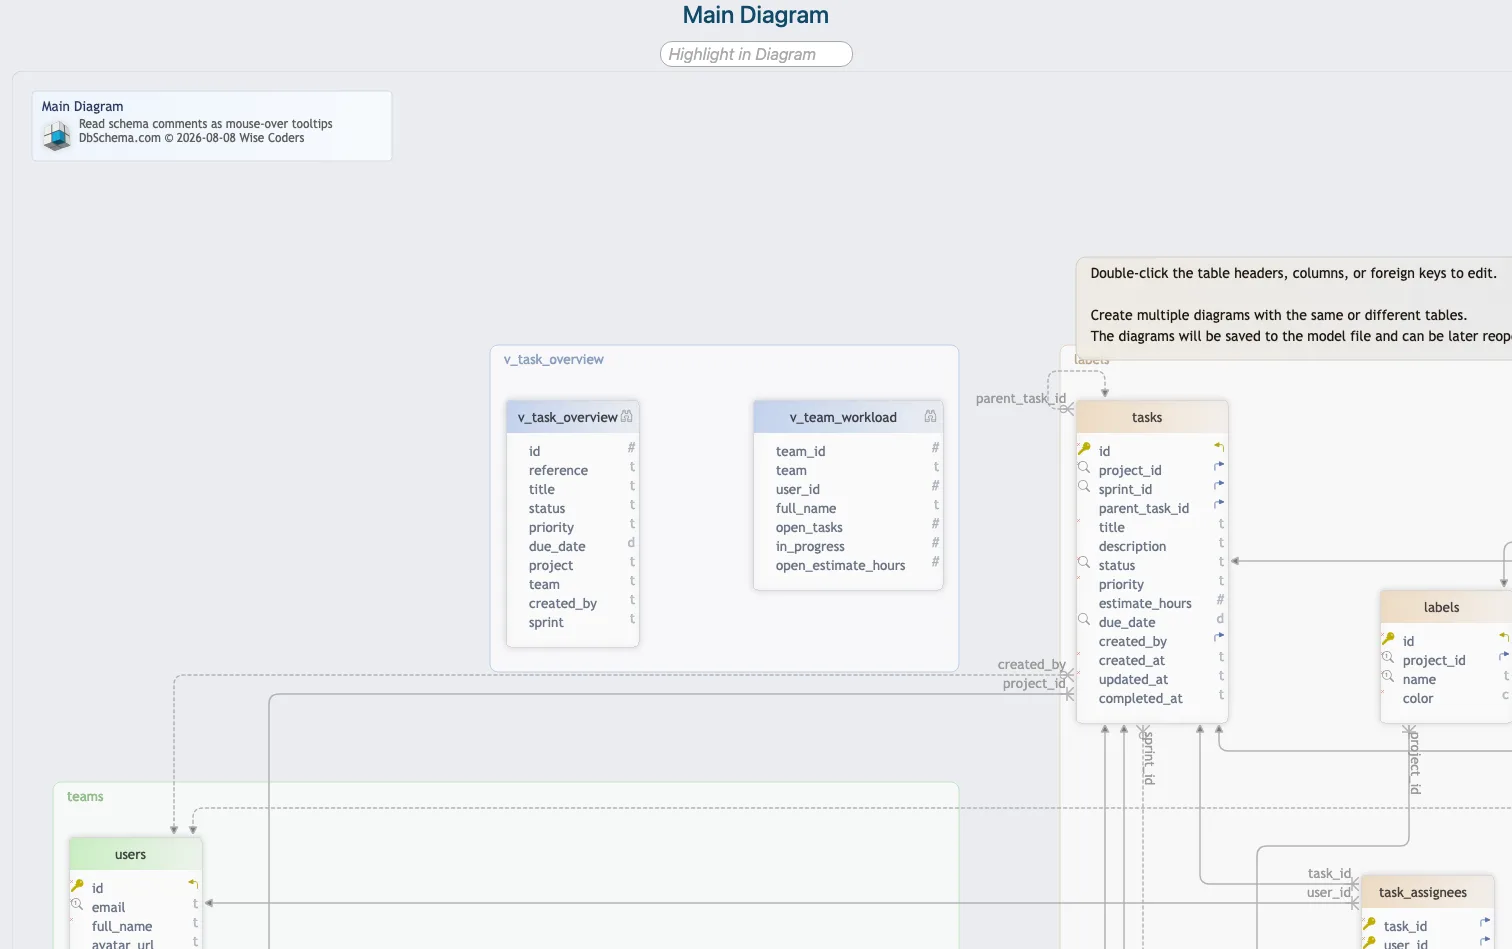
The third is dropping the metadata that makes a large diagram usable. Column comments, data types and index definitions are what let somebody who did not design the schema read it. DbSchema shows data types on the canvas when you enable Show Column Types from the Diagram menu, and carries table and column descriptions into the exported documentation as mouse-over tooltips. The fourth is ignoring relationships the database does not declare, which is common across microservice boundaries and in document stores: drag one column onto another in DbSchema and the virtual foreign key is saved in the model file, drawn as a connector line, and used for browsing and query building without being written to the database.
What is the best free diagramming tool?
DbSchema Community Edition, if the schema you are drawing already exists. It runs with no time limit and covers connecting, reverse-engineering, the interactive diagrams and the SQL editor across every supported SQL and NoSQL engine, which is the whole first pass on a large schema. Schema synchronization, the HTML5 documentation export and saving the model to a file are Pro.
The free browser tiers are drawn tighter, and the limits land exactly where a large schema hurts. dbdiagram.io's free plan carries 10 ER diagrams and one diagram view, with version history, table groups and detail levels listed as unavailable on that plan[1]. DrawSQL's free plan gives unlimited public diagrams capped at 15 tables each, with private diagrams starting on Starter[2]. Lucidchart's free plan stops at 3 editable documents of 75 shapes each[3].
| Free plan | What it covers | Where it stops |
|---|---|---|
| DbSchema Community | Reverse-engineering and interactive diagrams, 70+ engines, no time limit | Schema sync, documentation export and the model file are Pro |
| dbdiagram.io Free | 10 diagrams, SQL import and export, PDF, PNG and SVG export | 1 diagram view, no version history or table groups |
| DrawSQL Free | Unlimited public diagrams and the full visual editor | 15 tables per diagram, public only |
| Lucidchart Free | 3 editable documents, 100 templates | 75 shapes per document |
The shortlist and why each is on it
DbSchema
DbSchema is a desktop database design tool that connects to 70+ SQL and NoSQL engines. It reverse-engineers a live schema over JDBC, splits it across as many diagrams as you need inside one model file, and exports interactive HTML5, PDF and Markdown documentation from Diagram → Export HTML5 or PDF Documentation. It is licensed per user, as a perpetual licence or a monthly subscription, and the purchase page prices in your own currency on separate tabs for Business, Personal, and Universities & Students[4]. The Architect edition adds logical and conceptual design and your own AI provider key.
dbdiagram.io
dbdiagram.io is code-first schema design: you write DBML and the diagram renders from it, which is faster than drawing for anyone who would rather type. Its paid plans open up unlimited diagrams and diagram views, version history, table groups and detail levels, all of which the free plan leaves out. The first paid step, Personal Pro, is 8 USD a month with the pricing page's billing toggle on annual billing, or 14 USD a month with the toggle on monthly billing[1]. The schema lives in the text you maintain, so nothing reads it back from a server.
DrawSQL
DrawSQL is a browser-based schema designer with real-time multiplayer editing, aimed at web developers on MySQL, PostgreSQL, SQL Server and MariaDB. Its plans cap tables per diagram: 50 on Starter at 19 USD a month, 100 on Growth at 59 USD a month, and unlimited on Large[2]. A schema in the hundreds of tables therefore has to be split across diagrams or moved up a plan, and there is no offline desktop mode.
Lucidchart
Lucidchart is a general diagramming canvas for flowcharts, architecture drawings and org charts, with database shape libraries among the rest. One canvas covers the database diagram and everything else a team draws, which is the reason it appears on this list. Lucid prices its paid plans in the visitor's own currency, so check the plan page for your figures; the free plan's 3 editable documents and 75 shapes per document are the same everywhere[3].
How each handles the job in question
Table count is where the three browser tools show their edges first, because the ceiling is written into the plan rather than into the renderer: 15 tables on the DrawSQL free plan, 50 on Starter, 100 on Growth[2]. DbSchema has no such ceiling, and the model is a local file rather than a document on somebody's server.
Sharing the result matters as much as drawing it. A web canvas exports an image or a link, and both are snapshots. DbSchema generates interactive HTML5 documentation with the diagram as a vector image, a searchable table list, full column details, and table and column descriptions as tooltips, which a team browses locally or hosts on an internal server. The documentation export is Pro.
| Capability | DbSchema | DrawSQL | dbdiagram.io | Lucidchart |
|---|---|---|---|---|
| Offline model file | Yes | No | No | No |
| Several diagrams per model | Yes | Per plan limit | Paid plans | Manual pages |
| Compare against a live database | Yes, Pro | No | No | No |
| Interactive HTML5 documentation | Yes, Pro | No | No | No |
Try it on the schema that made you search for this. Download DbSchema at https://dbschema.com/download.html, connect it to the database, let it reverse-engineer the whole schema, then split the result into one diagram per subject area. Connecting, reverse-engineering, the diagrams and the SQL editor are in the free Community Edition; the model file, schema synchronization and the HTML5 documentation are Pro, and logical and conceptual design is Architect.
FAQ
Which ER diagram tool can draw a schema of several hundred tables?
DbSchema, because it reads the tables from the database over JDBC rather than from text somebody has to keep current. The opening section sets out what that changes once the schema is past the size one person holds in their head.
Can I generate an ER diagram from a database I already run?
Connect DbSchema over a JDBC driver and it reads the catalog in one pass. When the database moves on afterwards, Schema → Refresh Schema from Database pulls the current state back into the model and prompts you where it finds a difference.
Can ChatGPT create an ER diagram?
ChatGPT turns pasted DDL into Mermaid or PlantUML markup, and that markup renders as a picture. Nothing links it back to the database, so it cannot answer whether the picture still matches production; the section on generated markup above says what DbSchema does with that question instead.
How do I document a large schema for people who did not design it?
Text you type in the Description field of a table or column travels into the exported documentation, where it also shows as a mouse-over tooltip. DbSchema stores comment tags beside those descriptions, key-value pairs such as an owner or a sensitivity level, and they appear in the generated documentation as well. The documentation export is Pro.
Which free plan can I draw a large schema on?
DbSchema Community Edition, which has no time limit and no ceiling on tables. The free browser plans run out earlier: dbdiagram.io's free plan is single user[1], and on DrawSQL a private diagram starts on Starter, which carries ten of them[2].
How do you keep a diagram readable past 100 tables?
Split the schema into one diagram per subject area, then run Diagram → Auto Arrange, which lays the tables out with a graph algorithm. Snap guides hold the alignment when you drag individual tables afterwards.