Best Lucidchart Alternatives for Database Diagrams
For the engineer who has been drawing database diagrams on a whiteboard canvas and wants the next one read out of the database instead.
On this page
Somebody asks for the current ER diagram and the honest answer is that the one on the canvas is three releases old. DbSchema is the Lucidchart alternative that removes that gap: it reverse-engineers a live schema over JDBC, keeps the design in a versionable .dbs model file, and generates the migration script when the design moves ahead of the database. Miro, Microsoft Visio, Draw.io and ChartDB round out the shortlist below, compared on database connectivity, schema synchronization and current pricing.
What are the best Lucidchart alternatives?
The answer splits on one question: does the diagram have to come out of a database, or out of a shape library? For schema reverse-engineering, versioned design and migration scripts, a visual database modeler with a JDBC connection is the category, and DbSchema is the one this article recommends. For business diagrams that happen to include a few tables, Miro, Microsoft Visio and Draw.io are canvas tools with mature shape libraries.
Lucidchart itself is a browser diagramming tool with an Entity Relationship shape library. Its free plan covers 3 editable Lucidchart documents, 75 shapes per document and 100 templates, with paid Individual and Team plans above it; the pricing page renders the amounts in the visitor's own currency, so check it for the figure you would pay[1].
The ERD import is where the category difference shows. Lucid's help centre documents it as a copy-and-paste round trip: you open the Entity Relationship shape library, choose your DBMS in the import menu, copy the query Lucidchart gives you, run it against your database yourself, then paste the results back or upload a .CSV, .TSV or .TXT file. The matching "Export to SQL" dialog returns the page "with the exception of connections between tables"[2]. Nothing in that loop runs by itself, so the diagram is current until the next migration and no longer.
| Tool | Primary use | Database connectivity | Schema synchronization |
|---|---|---|---|
| DbSchema | Visual schema modeling and migrations | Live JDBC, SQL and NoSQL | Compare, diff and generate DDL |
| Lucidchart | Business flowcharts and architecture | Query results pasted in | None |
| Miro | Team whiteboards and planning | Manual or AI shape drafting | None |
| Microsoft Visio | Enterprise process and M365 diagrams | Static SQL or Excel import | None |
| Draw.io | Open-source web diagramming | Static XML or text import | None |
| ChartDB | In-browser DDL and query visualization | Single query result pasted in | Paid Teams plan |
DbSchema, the modeler that reads the database
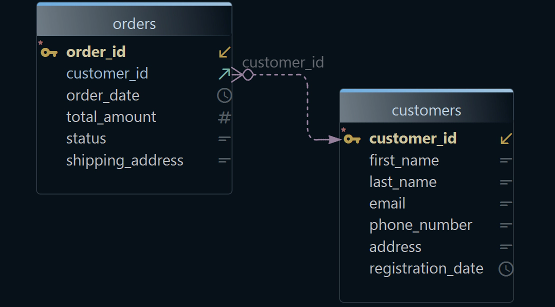
DbSchema connects to relational and NoSQL databases through JDBC drivers and turns the live catalog into an interactive ER diagram, then keeps that diagram as a design rather than as a view of a connection.
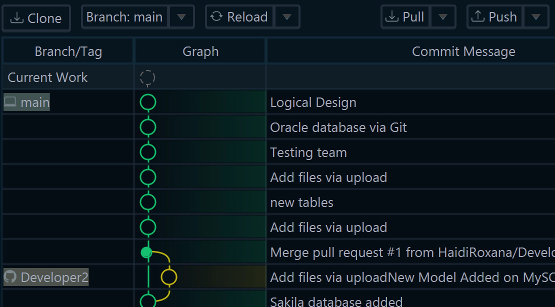
The two halves of the workflow stay separate on purpose. You build, modify and document the schema inside a local XML model file with a .dbs extension, which holds the diagram layouts, the table attributes, the virtual foreign keys and the column descriptions; nothing in that file touches a running database. Teams commit it into the Git repository, so a schema change goes through a pull request and a review the way application code does.
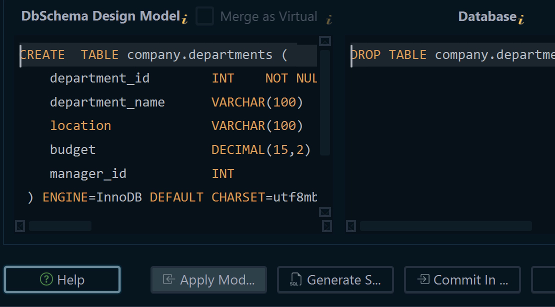
When the change is approved, DbSchema compares the model file against the target database and lists what differs across tables, columns, indexes and constraints. You choose per difference whether to update the model or push the change to the database, and Schema → Synchronize Model with Database writes the SQL for what you accepted, which you can read and edit in the dialog before clicking Execute. That is the only step in the workflow that changes a database.
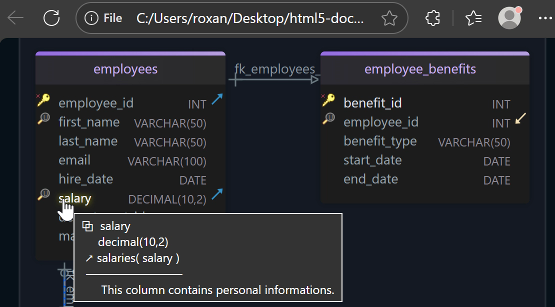
Three more things come out of the same file. Virtual foreign keys link tables the database never constrained: you drag one column onto another in the diagram, and DbSchema stores the link in the model file instead of writing it to the database. The Relational Data Editor then browses several related tables at once, refiltering each child pane as you select a row in the parent. And Diagram → Export HTML5 or PDF Documentation writes an interactive HTML5 database documentation page with the diagram as a vector image, a searchable table list, and column descriptions as mouse-over tooltips.
The free Community Edition covers all supported engines, connecting and reverse-engineering, interactive diagrams, creating tables and columns, and the SQL editor. Pro adds saving the design to a model file, the HTML5, PDF and Markdown documentation, the visual query builder, schema synchronization, relational data browse, the data generator and the data importer. Architect adds database-independent logical and conceptual design. Both paid editions are sold as a perpetual licence including the first year of upgrades, or as a monthly subscription, with separate business, personal and academic tiers[3].
Organization charts, marketing funnels and mind maps are not part of it. DbSchema draws databases, which is why the diagram can be generated rather than arranged.
Miro and Lucidchart for a team canvas
Miro and Lucidchart compete as browser collaboration canvases, and they aim at different moments in a project.
Miro is built around unstructured work: brainstorming, retrospectives and planning on an infinite canvas. It lists more than 250 integrations, and its AI features draft sticky-note clusters, mind maps and diagram blocks from a text prompt[4]. Lucidchart is the more structured of the two, with shape libraries for UML class diagrams, network architecture and ERD crow's-foot notation, plus grid snapping and alignment that produce a tidy figure for a slide.
Neither one connects to a database over JDBC, and neither generates a DDL migration script, so a table added in a release reaches either canvas only when a person redraws it.
Miro's free plan is limited to 3 editable boards, and Lucidchart's is the 3 documents and 75 shapes noted above. Miro lists Starter at $8 per member per month and Business at $20 per member per month, both billed yearly[4]. Both pricing pages price by the visitor's locale, so those are the amounts a visitor in the United States sees. Lucidchart's Individual and Team plans are named here without a figure for the same reason[1].
Does Microsoft have something similar to Lucidchart?
Microsoft Visio is the Microsoft 365 answer to Lucidchart, and it comes in three shapes. Visio in Microsoft 365 is included in Microsoft 365 commercial plans as a web and Teams app for viewing, editing and creating basic diagrams. Visio Plan 1 is $5.00 per user per month, paid yearly, and adds more than 1,000 shapes and icons, cross-functional flowcharts, detailed network diagrams, cloud architecture stencils, Power BI integration, and ERD and UML class diagrams. Visio Plan 2 is $15.00 per user per month, paid yearly, and adds the desktop app with offline and local file support, more than 250,000 shapes, AutoCAD support and data connectivity with two-way sync[5].
Diagrams made there live inside the Microsoft stack: co-authored in Teams, embedded in Word, linked to shape data from Excel and Power BI. What Visio's database stencils do not do is open a JDBC connection to a database server, read foreign key definitions from a catalog, or emit DDL to deploy a change, so the ERD is drawn rather than derived.
Is there a Google equivalent to Lucidchart?
Google Workspace ships no database diagramming application of its own. Teams working inside it reach for Google Drawings for a quick graphic, or for Draw.io when the diagram is technical.
Google Drawings is a free vector canvas inside Google Drive, with geometric shapes, lines and text boxes on a single page. It carries no database stencils, no cardinality markers and no multi-page management, so a schema of any size outgrows it quickly.
Draw.io, at app.diagrams.net, is an open-source diagramming web app under the Apache 2.0 licence that opens with no account and no credit card, and integrates with Google Drive, Docs and Slides, Microsoft SharePoint, OneDrive and Teams, Confluence and Jira, GitHub and VS Code[6]. Its shape libraries cover ERD, UML and cloud architecture.
| Feature | Google Drawings | Draw.io |
|---|---|---|
| Cost | Free with a Google account | Free, Apache 2.0 |
| Storage | Google Drive | Drive, OneDrive, GitHub, local disk |
| Database shapes | Geometric shapes only | ERD crow's foot and UML stencils |
| Live database connection | No | No |
| DDL migration export | No | No |
Draw.io covers the drawing job at zero cost and integrates where teams already keep their documents. Like Google Drawings, it holds a picture of a schema rather than a model of one, so nothing in it notices when the database changes.
ChartDB, the open-source browser modeler
ChartDB is an open-source, browser-based schema visualizer for developers who want an ER diagram without installing anything.
It works from one read-only query: you run it against your database server, paste the resulting JSON into the ChartDB interface, and it renders the diagram. The paid plans add an interactive DBML editor, database design, schema export and sticky notes, and the Teams plan adds real-time collaboration, an AI assistant, auto-sync, database migration and a change log with versioning.
The free tier is one user, 2 diagrams and 10 tables per diagram, self-hosted or in ChartDB's cloud under the AGPL. ChartDB Pro is US$39 a month, or US$25 a month billed yearly, for one user and one database with up to 100 tables. ChartDB Teams is US$99 a month, or US$59 a month billed yearly, for up to 3 users and 5 databases[7].
ChartDB renders a schema fast in a browser tab. The design itself stays in its cloud or in that tab, rather than in a file you commit, and multi-table data browsing is outside what it does.
Which one to run for your database
Pick by what has to survive outside the diagram. When the answer is the design itself, install DbSchema: the diagram, the interactive documentation and the migration script all come out of one .dbs file, across every engine DbSchema supports. That file travels through pull requests like any other file in the repository. When the answer is a picture for a meeting, Miro and Lucidchart do that on a shared canvas, Visio does it inside Microsoft 365, and Draw.io does it for free. When you want a schema rendered in a browser from one query, ChartDB does that.
Download DbSchema at https://dbschema.com/download.html and connect it to the database whose diagram is out of date. Reverse-engineer the schema into an interactive ER diagram, split it across several layout diagrams, and save the design to a .dbs model file for Git. Connecting, reverse-engineering, the diagrams and the SQL editor are in the free Community Edition; the model file, schema synchronization, migration script generation, the visual query builder and relational data browse are Pro; database-independent logical and conceptual design is Architect.
Frequently asked questions
What is the best alternative to Lucidchart for database diagrams?
DbSchema, where the diagram has to come out of the database rather than out of a shape library. It connects to 70+ SQL and NoSQL databases and downloads the JDBC driver for the engine you choose, so the first diagram costs a connection rather than a drawing session. Where downloads are blocked, you supply the driver .jar yourself.
Does Microsoft have something similar to Lucidchart?
Microsoft Visio is the Microsoft 365 equivalent, and the Visio section above carries both plan prices and what each plan adds. Neither plan reads a database catalog, which is the job DbSchema does over JDBC.
Is there a Google equivalent to Lucidchart?
Google Workspace ships no database diagramming application, so teams inside it reach for Draw.io, as the section above describes. Where the schema has to be readable in a repository or a wiki instead of on a canvas, DbSchema Pro exports it from Diagram → Export HTML5 or PDF Documentation as Markdown, one section per table with its columns, types and descriptions. The HTML5 format from the same dialog opens in any browser with no server behind it.
Can Miro or Lucidchart reverse-engineer a database?
Neither connects to a database server. Lucidchart's ERD import asks you to run a query yourself and paste the result back, and Miro has no database import at all, while DbSchema reads the catalog directly through a JDBC driver.
Who are Lucid Software's main competitors for a database diagram?
DbSchema and ChartDB are the ones that read a schema rather than draw it, and DbSchema is also the one that writes the migration script when the schema moves. Miro, Microsoft Visio and Draw.io compete with Lucid Software on general diagramming, where the deliverable is a picture.
Sources
Diagram the database you actually have
DbSchema reverse-engineers a live schema over JDBC, keeps the layout in a versionable .dbs model file, and generates the migration script when the design moves. Interactive diagrams and the SQL editor are in the free Community edition.