Visual Query Builders Compared
For the analyst or developer who assembles SELECT statements against a schema somebody else designed and would rather read the joins off a diagram.
On this page
Ninety tables, a question that needs four of them, and no memory of which column carries the customer key. DbSchema is the query builder for that day: you click a table header on the diagram, follow its foreign keys to the related tables, tick the columns you want, and the SQL appears at the bottom of the builder as you work[2]. The builder ships in the Pro edition; the SQL editor it feeds is free in Community.
Five other tools come up on the same shortlist, and they differ less in how they draw a join than in what else the drawing is connected to. DBeaver, DbVisualizer, pgAdmin, Navicat and dbForge Studio are compared below on engines, price and what happens to the query after you run it.
What is a visual query builder?
A visual query builder turns clicks on a schema into a SELECT statement. You pick tables, tick columns, connect the tables the way their keys already connect them, and the builder writes the syntax. Nothing has to be remembered, because everything on offer comes from the schema in front of you.
The DbSchema Query Builder opens inside the diagram, and it is saved to the model file rather than to a scratch buffer, so a query you assembled last week reopens from the Editors menu[2].
From the diagram to the SELECT statement
- Click a table header in the diagram to open the builder loaded with that table, or choose Editors → New Query Builder for a blank canvas.
- Click the small arrow icon next to a column to follow a foreign key and add the related table.
- Click the join type label on the connecting line to switch between INNER JOIN, LEFT JOIN and EXISTS.
- Tick the checkbox next to every column that belongs in the SELECT list.
- Right-click a column and choose Filter to add a WHERE condition, with the operator and value set in the filter dialog.
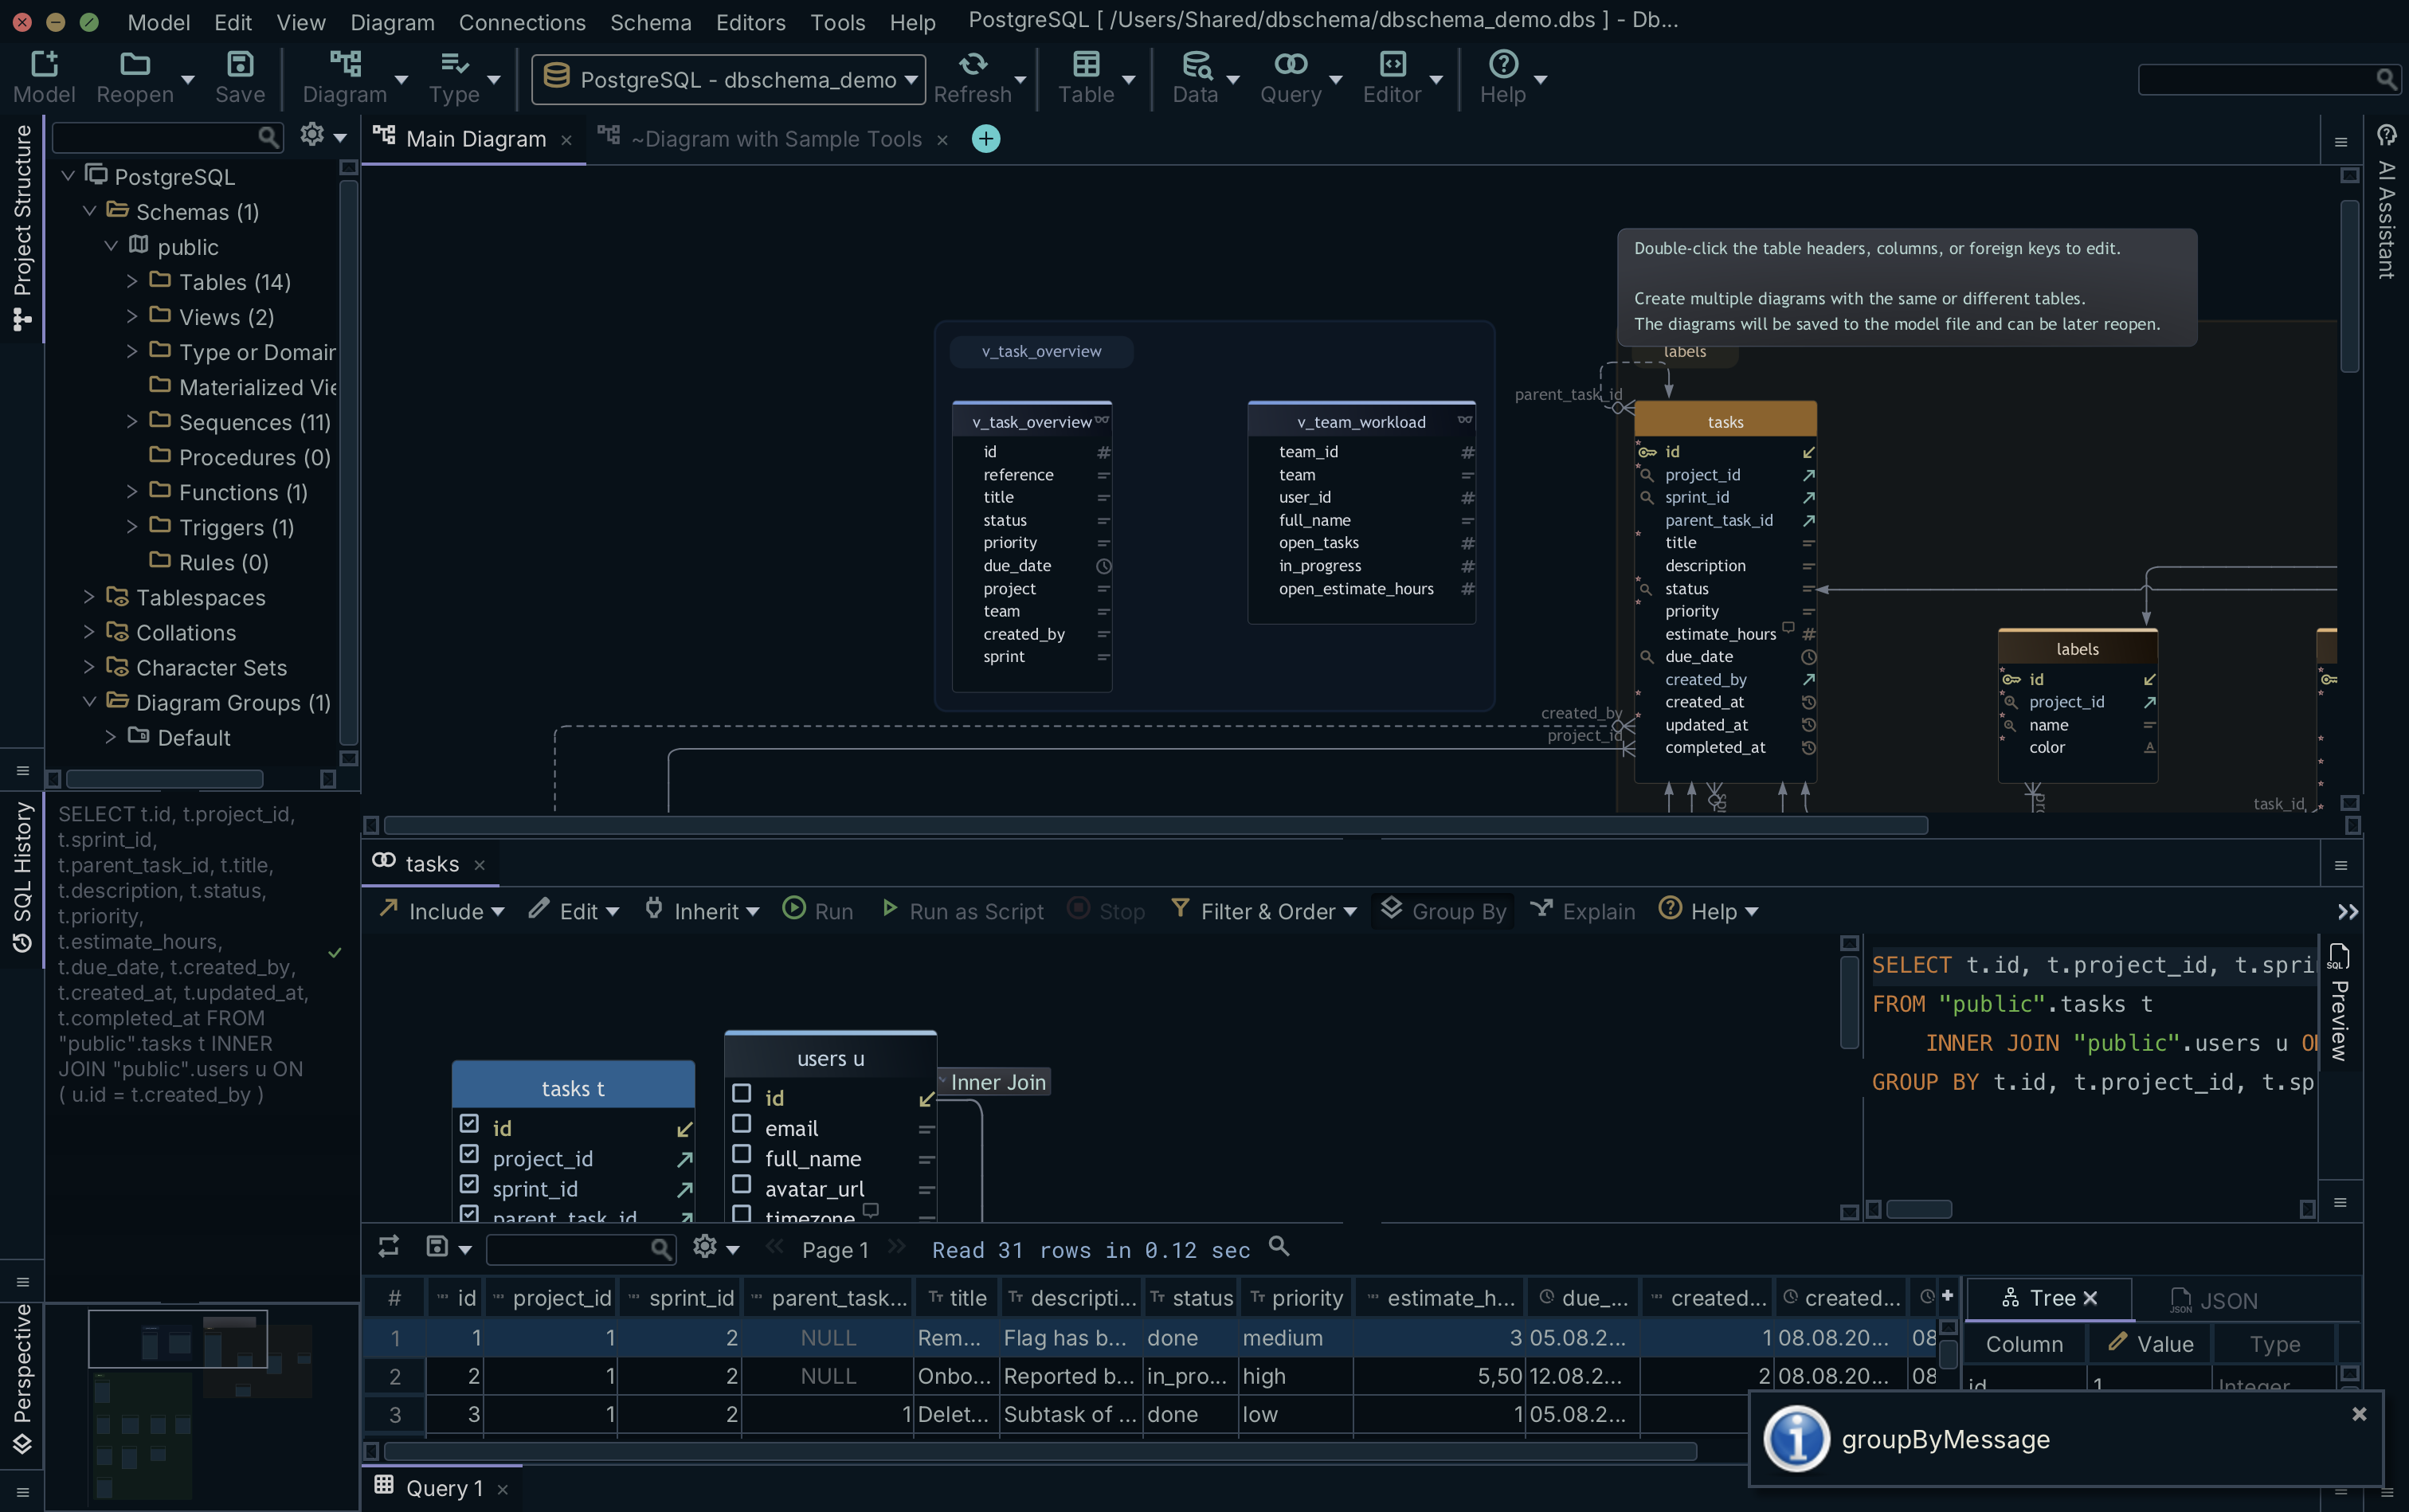
- Switch on Group By in the toolbar, then right-click a column and choose Aggregate for MIN, MAX, SUM, AVG or COUNT.
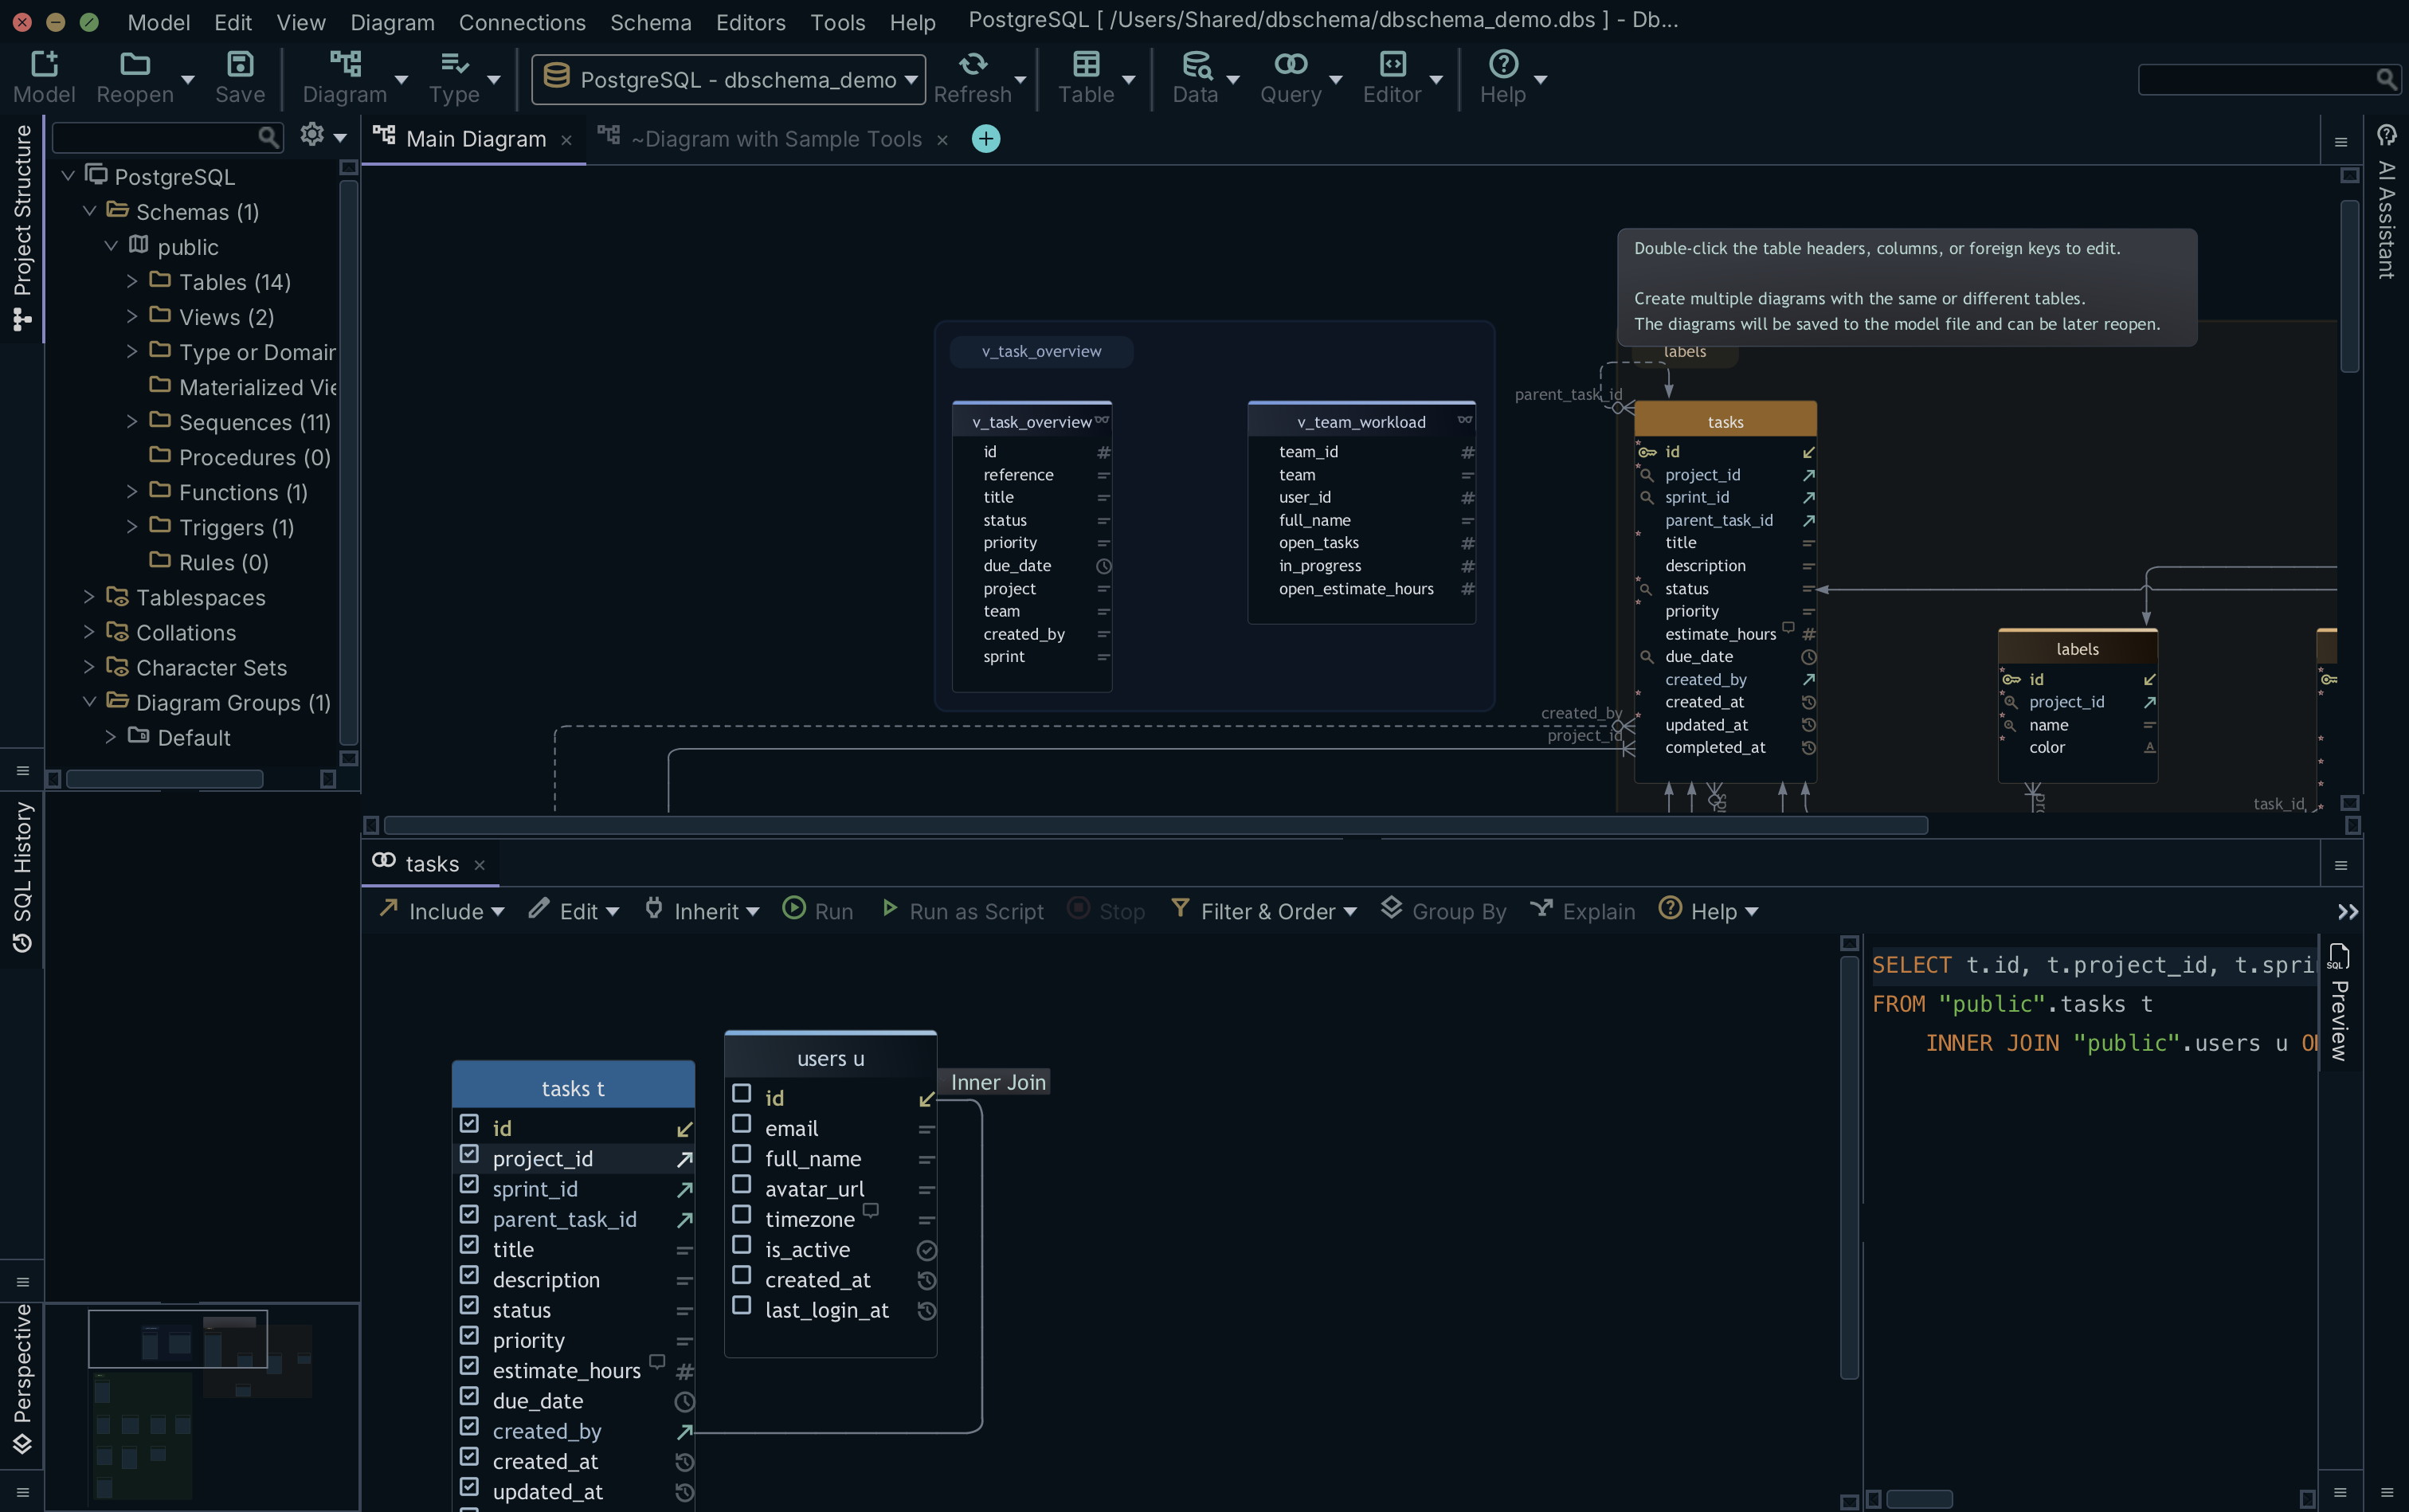
The generated SQL updates as you click and sits at the bottom of the builder, so the statement is readable before it runs. Building the query changes only the model file; the database sees nothing until you execute it.
Why use query builder?
The reason is not that SQL is hard. It is that an unfamiliar schema is hard, and a builder grounded in the catalog only offers what exists. A column that was renamed two releases ago is not in the list. A join the schema declares is one arrow click away, and a join it does not declare has to be created deliberately, which is a useful thing to be forced into.
Assembling the query on the diagram also keeps the shape of the data visible while you work. You can see that the table you are aggregating hangs off two parents, and that the count you were about to write would multiply rows. That is the class of mistake that survives review, because the SQL is valid and the number is merely wrong.
The last argument is speed on throwaway work. A question that will be asked once, about tables you will not touch again, does not deserve twenty minutes of reading DDL. Ticking six columns and reading the generated statement takes a fraction of that, and the statement is still SQL you can copy into an editor and tune.
Which IDE is best for SQL?
The answer follows the engines you connect to and how much of the schema you want to keep. This table lists what each tool covers and what the vendor charges today.
| Tool | Engines | Free tier | Listed price | Platform |
|---|---|---|---|---|
| DbSchema | 70+ SQL and NoSQL | Community, no time limit | Pro, one time or monthly | Windows, macOS, Linux |
| DBeaver | SQL and NoSQL via bundled JDBC drivers | Community, open source | Lite $113 a year, Enterprise $255 a year | Desktop and web |
| DbVisualizer | Relational engines via JDBC | Free tier, standard features | Pro $199 first year, $89 after | Desktop, Java |
| pgAdmin | PostgreSQL | Free, open source | Free | Desktop and browser |
| Navicat Premium | Nine, from MySQL to Snowflake | Trial | 799.99 USD a year, 1,599.00 USD perpetual | Desktop |
| dbForge Studio | SQL Server and Azure SQL | Trial | Standard $299.95 a year | Windows |
Prices move with the switches on each vendor's own page: purchase type, subscription length, seat count and, for some pages, the country you open them from. The DbSchema amounts are on its purchase page rather than in this table, on a Business tab, a Personal tab and a Universities & Students tab, the last two cheaper for the same editions, and the page shows them in your own currency. Check the figure at the point of purchase rather than trusting a comparison table, this one included.
Two columns decide most shortlists. The engine column decides it for anyone whose stack has more than one database in it, because a per-engine product has to be bought again for each dialect while a DbSchema licence covers every engine it supports. The free-tier column decides it for everyone else: DbSchema Community has no time limit, so the connection, the diagrams and the SQL editor stay usable after an evaluation ends, while the builder, the data browse and the saved model file sit in Pro.
What is the best SQL visualization tool?
Three of the six are worth a closer look, because they take the schema in three different directions.
What DbSchema does with the schema
DbSchema keeps the schema as a design model in a local .dbs file, and the query builder is one of the things that model feeds. Connecting and reverse-engineering pull the tables in, the diagram is the working surface, and the same file produces interactive HTML5 documentation and the schema comparison against a live database.
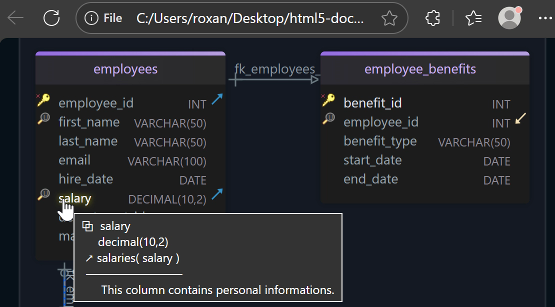
Virtual relations are the part analysts notice first. Where the database declares no foreign key, you drag one column onto another in the diagram and DbSchema saves that link in the model file; the Query Builder then follows it exactly as it follows a declared key[2]. Nothing is written to the database, so a reporting shortcut costs you no schema change.
The free Community Edition covers every supported engine, reverse-engineering, interactive diagrams, creating tables and columns, and the SQL editor. Pro, a one-time purchase plus taxes, adds the visual query builder, relational data browse, the saved model file, schema synchronization and the documentation export; Architect, one tier up, adds logical and conceptual design[1].
Where DbVisualizer fits
DbVisualizer is a universal JDBC client, aimed at querying and administering many relational engines from one window. The free tier covers the standard feature set, and a Pro subscription opens the full feature set at $199 per user for the first year and $89 from the second year onwards, excluding VAT. The subscription carries a perpetual usage licence for the versions released during its term, so lapsing costs you updates rather than access[4].
What DBeaver covers
DBeaver reaches a wide range of SQL and NoSQL databases through bundled JDBC drivers, and DBeaver Community is free and open source. On the edition comparison, Lite at $113 a year ($12 a month) lists the visual query builder, in-line data editing, ER diagrams and a simplified analyst view; Enterprise at $255 a year ($26 a month) adds development tools, DBA dashboards, Git integration and cloud support; Ultimate at $510 a year adds the cloud explorer[3]. The edition list does not include virtual relations or cascading multi-table browsing, which is where database design tools diverge from database clients.
What does query builder do?
The other three are shaped by the ecosystem each one serves.
pgAdmin and the PostgreSQL ERD tool
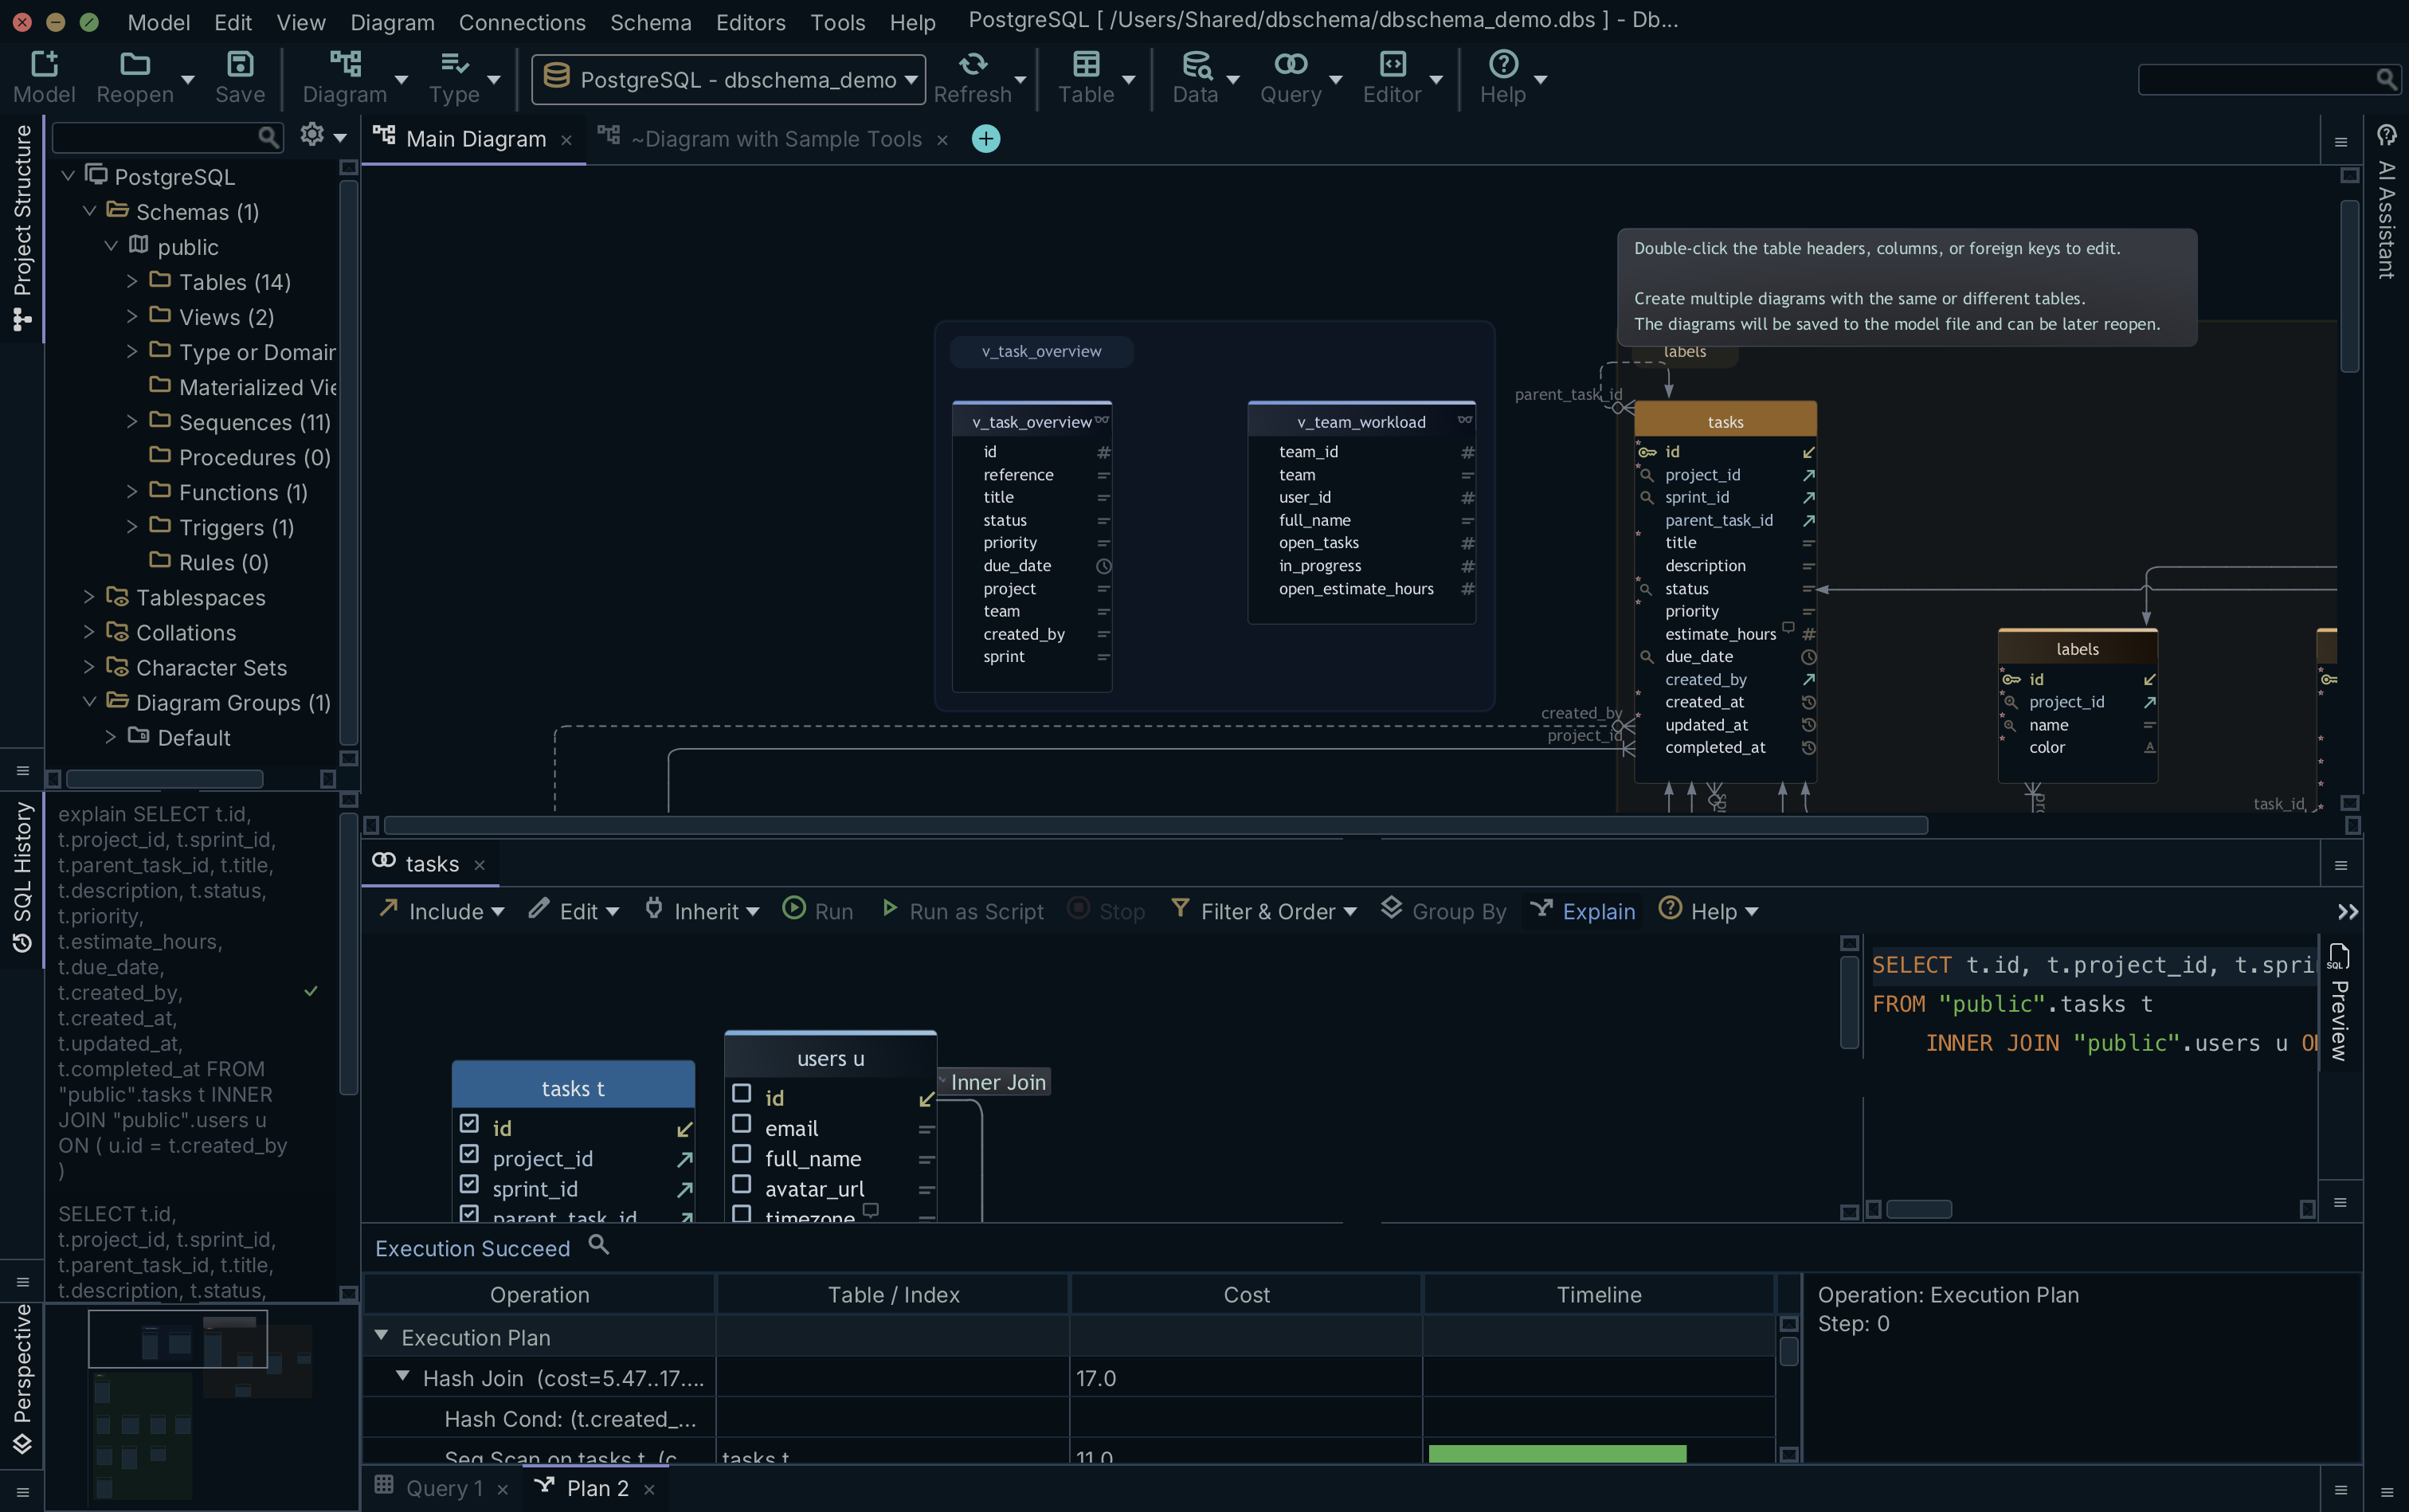
pgAdmin is the free, open-source administration and development platform for PostgreSQL. Its ERD Tool designs and visualizes tables and their relationships, saves a diagram to a file and opens it again later, generates ready-to-run DDL into a query tool, and can build the diagram from an existing database, schema or single table, with the traversal depth configurable in the preferences[5]. The query tool itself offers syntax highlighting, auto-completion, query history and a graphical EXPLAIN. What it does not carry is a second engine: everything here is PostgreSQL.
Navicat Premium across nine engines
Navicat Premium connects to MySQL, PostgreSQL, MongoDB, MariaDB, SQL Server, Oracle, SQLite, Redis and Snowflake from one application, with a query builder among its development features[6]. Navicat lists Navicat Premium Enterprise at USD 79.99 a month, USD 799.99 a year, or USD 1,599.00 for a perpetual licence[7].
dbForge Studio inside SQL Server
dbForge Studio for SQL Server, from Devart, targets Microsoft SQL Server and Azure SQL. Visual query building sits in the Standard edition alongside code completion, query profiling and T-SQL debugging; Professional adds schema and data comparison, code analysis and command-line automation; Enterprise adds source control integration, unit testing and documentation. Devart lists a one-year subscription at $299.95 for Standard, $479.95 for Professional and $659.95 for Enterprise, before taxes, with a switch between subscription and perpetual licensing and one, two or three year durations[8].
How can I visualize a SQL query?
Visualizing a query means putting the tables on a canvas and letting the relationships between them do the joining. Dragging in a table brings its keys with it, ticking a column adds it to the projection, and a filter on a column becomes a condition rather than a line of syntax you have to place correctly.
Going deeper with the Relational Data Editor
A builder produces one flat SELECT. Walking a hierarchy, from a parent row to its children to their children, is a different job, and in SQL it is several queries or one wide join nobody enjoys reading.
The Relational Data Editor does it without a query. Open it from Editors → New Relational Data Editor, or right-click a table header in the diagram and choose Open in Relational Data Editor. Click the foreign key button on the table header panel to descend into a child table, which appears as another pane filtered to the selected parent row. Selecting a different row in the parent reloads every child pane, and the cascade continues through multiple levels[9]. Where the schema declares no foreign keys, the virtual ones you drew in the diagram serve instead.
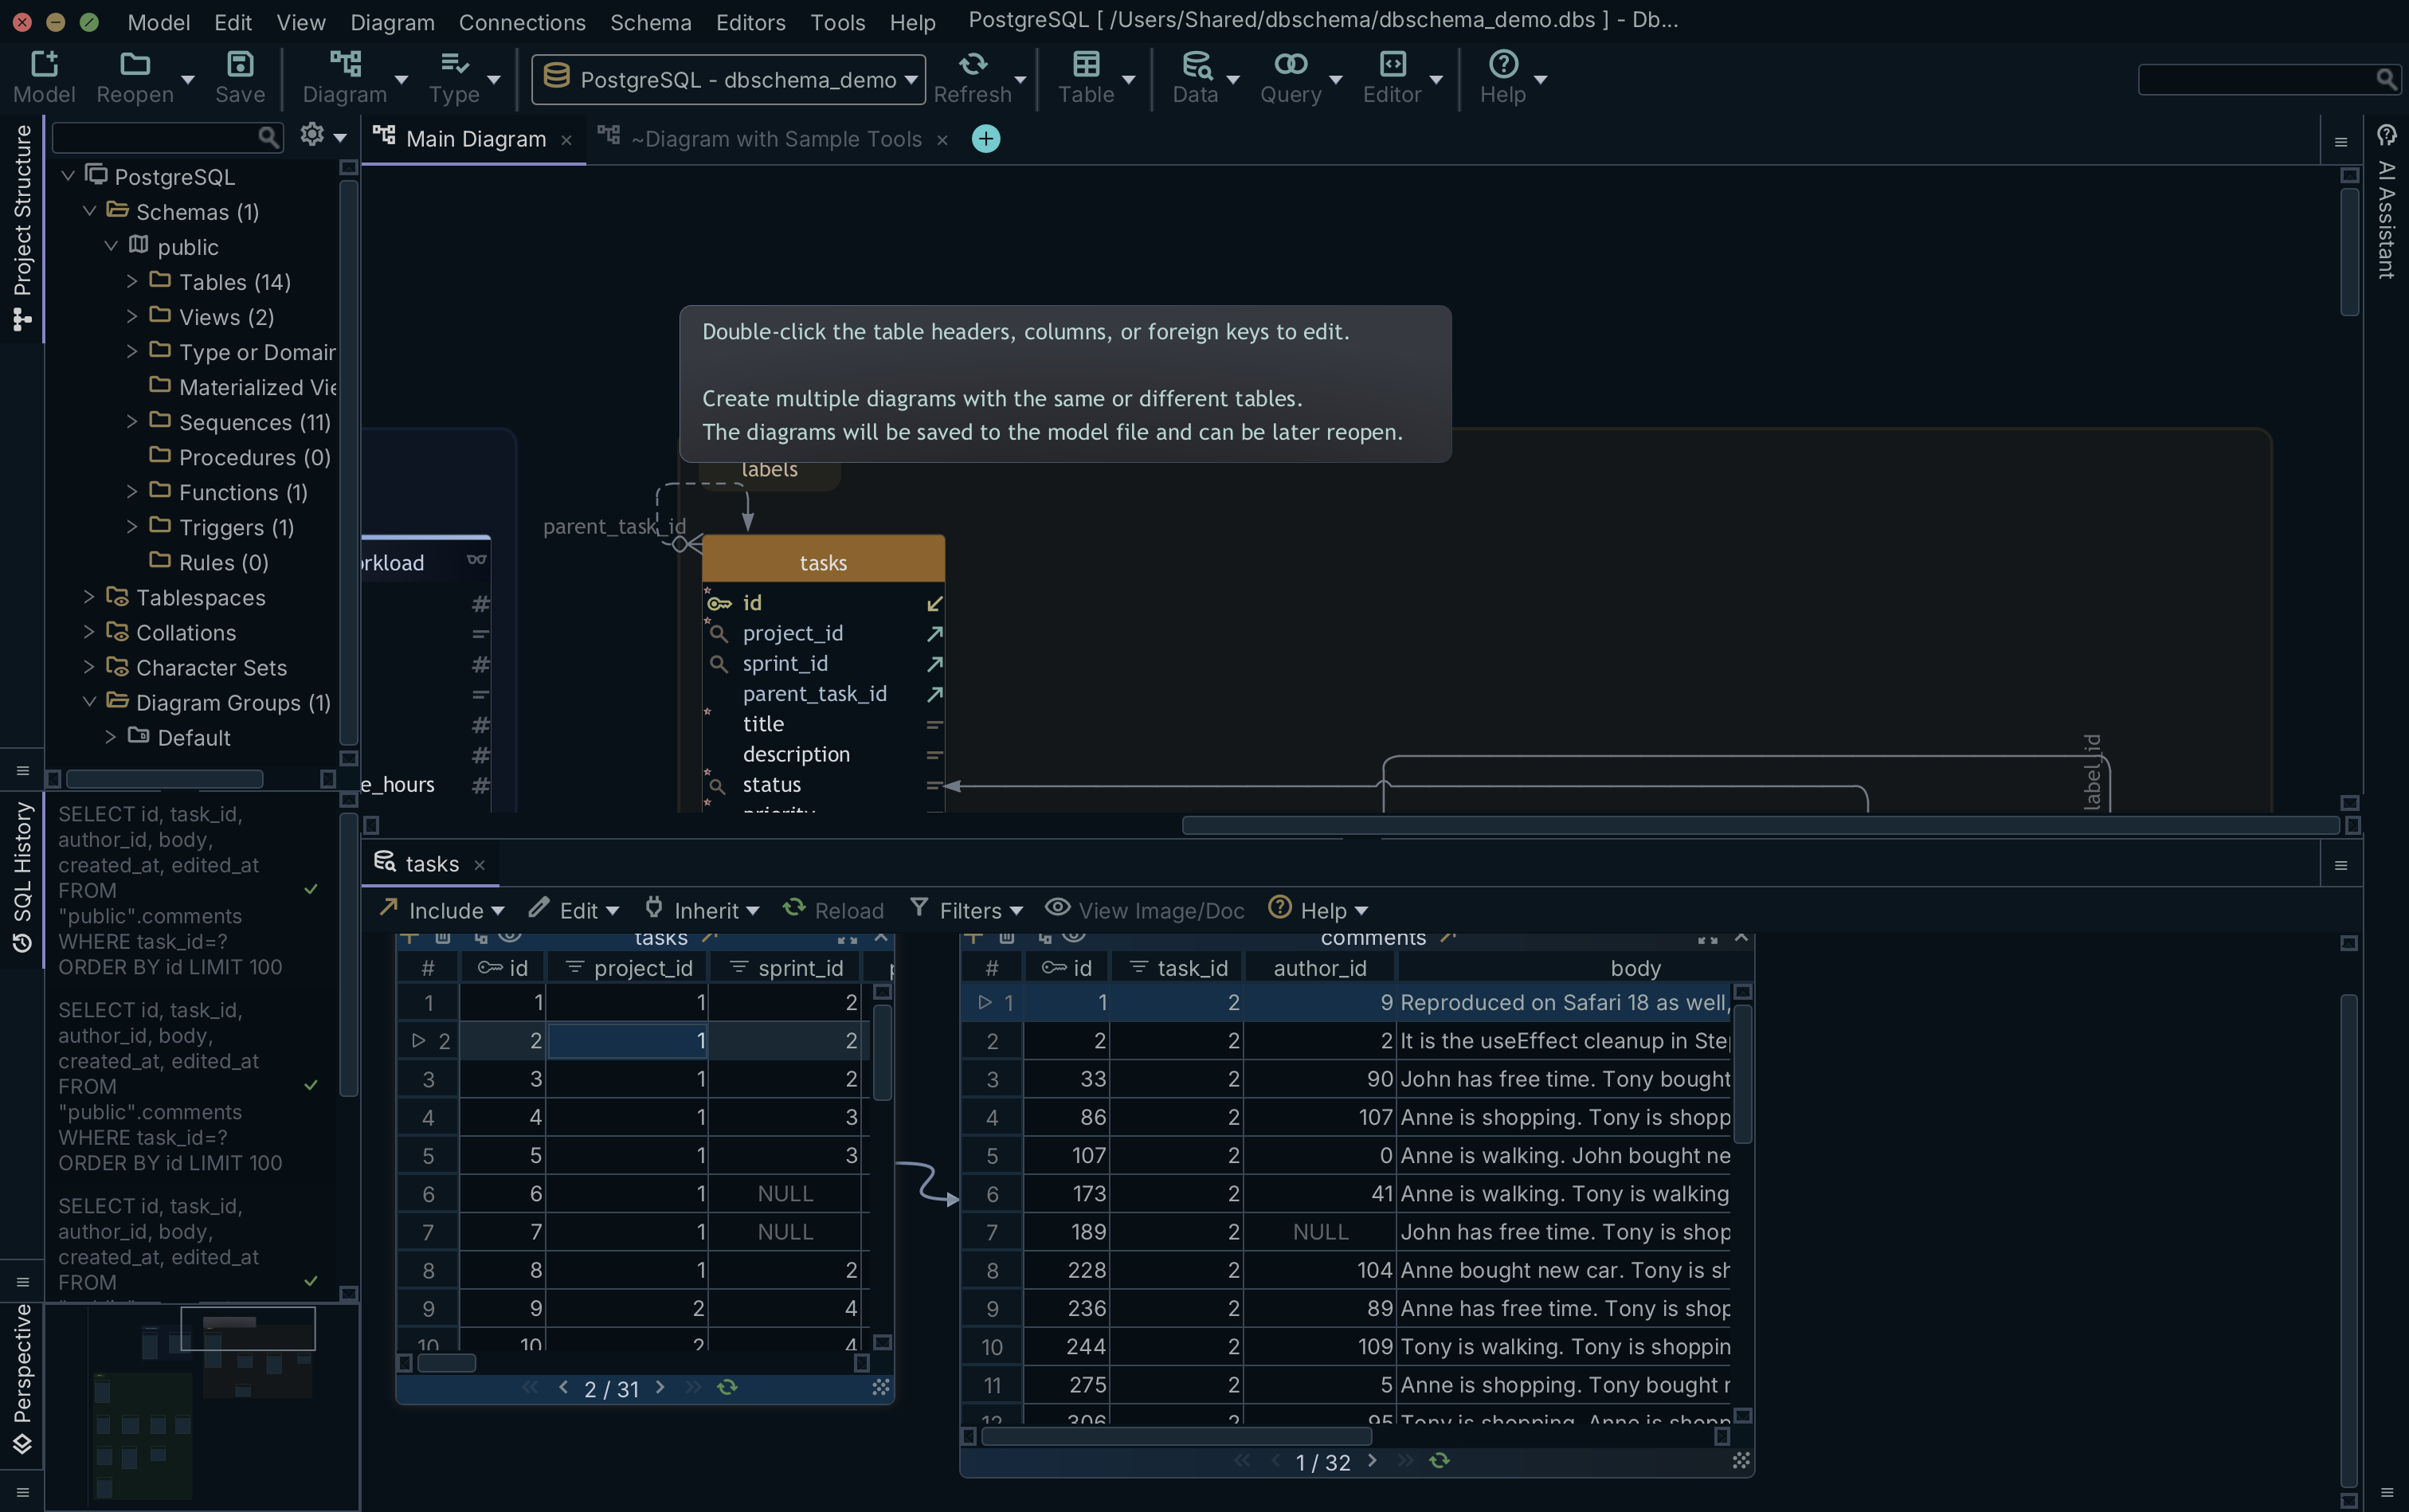
Edits made in those panes are held until you click Commit, and Rollback discards them, so browsing a production table is not one keystroke away from changing it[9]. Relational data browse is a Pro feature, as is the visual query builder.
The short version of the workflow
- Add the tables you need to the canvas from the diagram.
- Follow the foreign keys, or drag one column onto another to create a virtual relation first.
- Tick the output columns on each table.
- Add filters on the columns that need them.
- Read the generated SQL, run it, and open the related rows in the Relational Data Editor when one result raises the next question.
What are the 5 basic SQL commands?
Five statements carry most database work: SELECT, INSERT, UPDATE, DELETE and CREATE. A visual builder covers the first of them, and the rest are covered by the parts of the application around it.
Reading is where the builder earns its place: SELECT, with its joins, filters and aggregates, is the statement whose syntax costs the most to get right on an unfamiliar schema. INSERT, UPDATE and DELETE happen in a data pane, where the Insert button opens an edit form for a new row and a double-clicked cell is edited in place, with every change held until you click Commit. CREATE happens on the diagram, where a table you draw becomes the DDL that DbSchema generates for the target engine, and the same model then feeds the database documentation the rest of the team reads.
Download DbSchema at https://dbschema.com/download.html, connect it to a database you query often, and build the next report from the diagram instead of from memory. Connecting, reverse-engineering, the diagrams and the SQL editor are free in Community; the visual query builder and relational data browse are in the Pro edition.
FAQ
Do I need to know SQL to use a query builder?
Not to build one: the DbSchema Query Builder constructs a SELECT with the mouse alone, and the six steps above are the whole vocabulary it asks for. Reading SQL pays off afterwards, when you tune the statement in the SQL editor or explain it to somebody in review.
Can I keep a query I built and reopen it later?
The Query Builder is saved into the design model, so it comes back with the model file rather than dying with the session. When you close one, DbSchema asks whether to keep it in the design model for later or drop it permanently.
Can visual query builders handle databases with no foreign keys?
Virtual relations answer that case, and they also link a view, which carries no foreign key of its own. Drag from a column in one table to the target column in another and DbSchema asks whether the key is real or virtual; pick virtual and the link exists only in the .dbs model file, with no constraint created in the database[10]. The Query Builder and the Relational Data Editor then follow it exactly like a declared foreign key.
Can I export the result of a query I built?
Click Save in the result pane and DbSchema re-executes the query and writes every row to a file. That is the route for a result set too large to page through on screen, and it runs from the same builder rather than from a separate export tool.
Sources
Build queries from the diagram
DbSchema's visual query builder assembles joins from the schema, previews the generated SQL before you run it, and browses related tables over virtual foreign keys. The SQL editor is free; the query builder ships in the Pro Edition.