Choosing an ER Notation Your Team Can Read
Compare Chen, crow's foot, Barker, IDEF1X and UML class diagrams and pick the ER notation your readers can read, then render one model in it.
On this page
Chen notation and what it is good for
For database architects who design schemas visually and hand the diagrams to developers, reviewers and stakeholders; this article compares the five notation families you will actually meet and shows how to settle on one per readership. The choice comes up once per model and then sticks: every diagram, every export and every review afterwards is read in the notation you picked. The question that decides it is not which notation is best. It is who has to read the diagram, because a room of developers, a data-governance reviewer and a non-technical sponsor do not read the same symbols equally well.
Chen notation is the original. Entity-relationship modelling was set out by Peter Chen in a 1976 paper in ACM Transactions on Database Systems, which introduced a diagrammatic technique as a tool for database design[1], and the notation that carries his name draws entities as rectangles, relationships as labelled diamonds between them, and attributes as ovals connected to the shape they describe.[2]
The diamond is the notation's defining move. A relationship is a first-class object that can carry attributes of its own, so a fact that belongs to the association rather than to either end has somewhere to sit. When the association itself has data attached, Chen shows it directly, where the line-end notations force you to promote the relationship to an entity of its own.
That explicitness is also the cost. Every attribute is a shape, so the ovals multiply faster than the tables, and a fifty-table model becomes a page of circles crossed by lines. The model's own reference puts it plainly: attributes are often omitted because they clutter the diagram, and other notations list them inside the entity rectangles instead.[2] Chen survives in classrooms and conceptual workshops for the same reason it fades out of production models: it teaches the concepts well and packs poorly.
If you need the symbol-by-symbol reference, the ERD symbols guide on this site covers what each mark in each notation means. The rest of this article is about choosing between them, not decoding them.
Crow's foot and Information Engineering
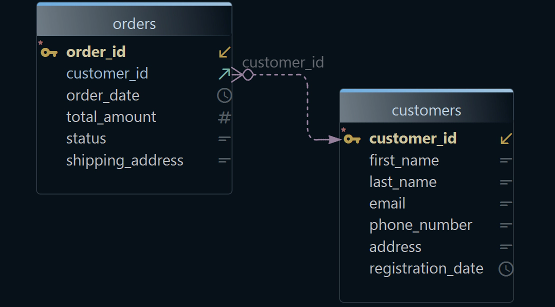
Crow's foot is the notation most working schemas are drawn in, and the one most diagramming tools render by default. Entities are plain rectangles with the attributes listed inside, and everything the reader needs to know about a relationship sits at the two ends of its line.
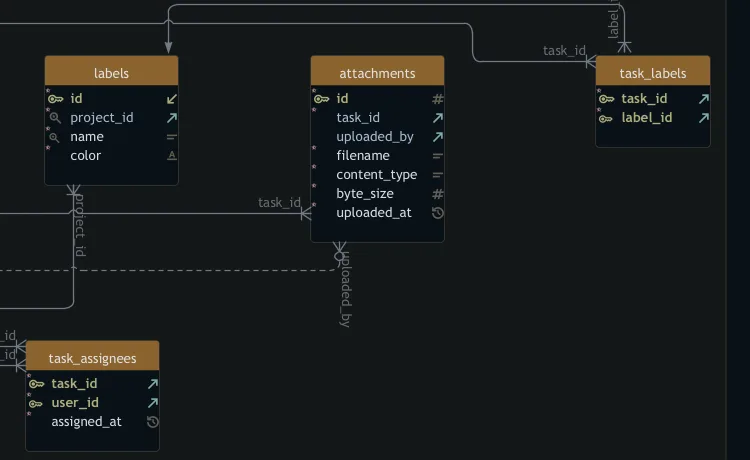
The lineage is Information Engineering. The convention traces back to Gordon Everest's 1976 paper "Basic Data Structure Models Explained With A Common Example", presented at the Fifth Texas Conference on Computing Systems in Austin, which is thought to be the first to use what is now called a fork to represent multiplicity in a relationship.[3] The crow's foot style spread from there through consulting practice and modelling textbooks, and it is the style that Barker's Oracle CASE variant was built on.[4]
Three symbols do all the work: the ring for zero, the dash for one, the crow's foot for many. Used in pairs at the line end, the inner symbol gives the minimum and the outer one the maximum. A reader decodes cardinality and optionality straight off the line, with no legend and no trip to a definitions page.
The trade-off is the one Chen does not have: in crow's foot, relationships cannot have attributes. Where the association itself carries data, the relationship is promoted to an entity in its own right. The standard example is an artist performing a song: to capture where and when the performance happened, you introduce a performance entity with time and place attributes, and the artist-to-song relationship becomes two relationships through it.[2] That is not a loss so much as a discipline: the thing with attributes becomes a table, which is where a relational engine would put it anyway.
Barker, IDEF1X and UML class diagrams
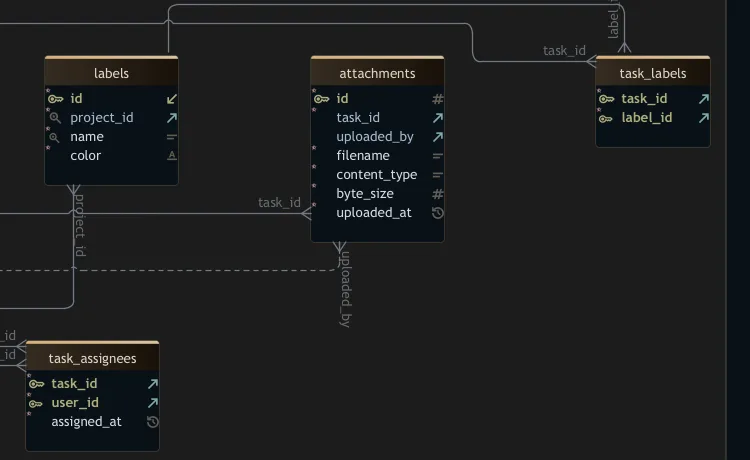
Barker notation is what a reader with Oracle Designer heritage expects. Richard Barker, Ian Palmer, Harry Ellis and colleagues developed it at the British consulting firm CACI around 1981, Barker took it with him when he joined Oracle, and it is defined in his book Entity Relationship Modelling in the CASE Method series. It has been used by Oracle's CASE modelling tools since.[4]
- Optionality shown as a dashed half-line, so an optional relationship reads as a broken line on the optional end
- An exclusion arc where two relationships are mutually exclusive
- Nested boxes for abstraction, a subtype drawn inside its supertype
It is a variation of the crow's foot style, and it was favoured by many over the original Chen style for its readability and efficient use of drawing space.[4] Attributes live inside the entity box rather than in ovals, so a Barker diagram holds visibly more schema per page than a Chen diagram of the same model. For a stakeholder review, that difference decides whether the whole domain fits on one page or needs a flipchart.
The cost is familiarity outside its home ground. The dashed half-line for optionality is convention, not a symbol every reader has met, so a team with no Oracle history needs one line of legend to read it. Inside an Oracle-influenced organisation the opposite is true, and Barker is the notation nobody there has to think about.
IDEF1X and identifying relationships
IDEF1X is the discipline-heavy member of the family. Its primary distinction is identifying versus non-identifying relationships, drawn as solid versus dashed lines: an identifying relationship makes the child identifier-dependent, so the parent's primary key migrates into the child as a role-named foreign key rather than the child standing on its own identifier.[5] Whether a child borrows its identity from its parent is a decision you make once per relationship and carry into the physical keys, which is why the notation appeals to modelers who want that decision visible on the diagram.
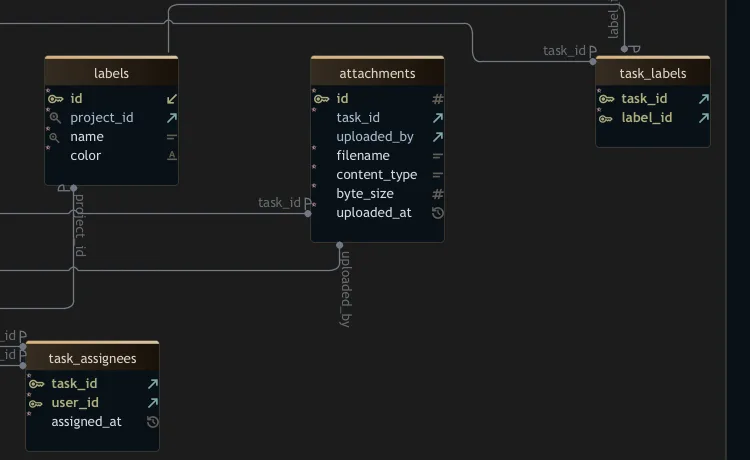
It is also the one with a standard behind it. In December 1993 the Computer Systems Laboratory of NIST released IDEF1X as a standard for data modelling in FIPS Publication 184, and IEEE adopted IDEF1X in 2012.[6] For a governance reviewer who learned modelling under that standard, IDEF1X is not one option among several; it is what a data model is supposed to look like.
The cost is what the discipline assumes. IDEF1X requires a key for every entity, one primary key chosen from the candidate keys, and foreign keys represented explicitly with role names.[5] Its key-style language is built for relational and extended relational databases, with a separate identity-style language added later for object databases and object-oriented modelling.[5] That makes it a strong fit for governance and formal logical design, and a poor fit for the diagram you put in front of a sponsor.
UML class diagrams as the fifth notation
A software team may already read UML class diagrams fluently, which is reason enough to treat them as the fifth notation. Classes are drawn as boxes with three compartments: the class name on top, the attributes in the middle, the operations at the bottom.[7]
The language is standardised by the Object Management Group, and UML 2.5.1 has been a formal specification since December 2017.[8] The specification notes that class diagrams can also be used for data modeling, and for a mixed engineering audience that is the whole appeal: the developers, the architect and the tech lead read one diagram set, and no second notation has to be taught.[7]
The cost shows up at the edges. The bottom compartment lists operations the class can execute, and a relational schema has no operations. UML relationships such as aggregation, composition and generalisation describe object structure and lifecycle, not keys and constraints, so a DBA or a governance reviewer gets less out of the diagram than a developer does. UML earns its place when the readership is engineers; it earns its keep poorly when the readership is anyone whose world is tables and referential integrity.
Choosing by who has to read the diagram
The readership decides the notation, not personal preference. The same model drawn for a design review, a governance audit and a stakeholder workshop is read by three different vocabularies, and the notation that is invisible to one reader is a puzzle to another.
| Reader | Reads without a legend | Slows the review |
|---|---|---|
| Application developers | Crow's foot, UML class diagrams | Chen, with its attribute ovals |
| Data-governance reviewer | IDEF1X, with its key discipline | Free-form boxes with no key convention |
| Non-technical stakeholder | Barker or crow's foot boxes | Chen diamonds, UML operations |
The audience also follows from the level of the model. Data modelling runs from a conceptual model, used to discuss initial requirements with business stakeholders, through a logical model documenting structures that can be implemented in databases, to a physical model organised into tables.[9] The conceptual diagram goes to the workshop, the physical one to the deployment review, and the notation for each should be chosen for the room it lands in. The logical-level decisions themselves, keys and normal forms, are their own topic, covered in Normal Forms Without the Theory.
One failure is worth naming because it quietly undoes the whole choice: mixing notations inside one model. A reader who has to work out which convention this particular diagram uses has already lost the benefit of any of them, because the point of a notation is that the line ends read without thought. Pick one per model, and write the choice down where the team can see it.
Where each notation stops working
The limits are worth stating honestly, because the choice has to be defended to the people who will read the diagram. Each one below comes from the notation's own documentation, not from a verdict about which notation is correct.
Chen stops working at scale. Attribute ovals multiply faster than tables, which is why attributes are routinely omitted from Chen diagrams and why other notations list them inside the entity rectangles instead.[2] A fifty-table model drawn in full Chen is a diagram nobody reads twice.
Crow's foot stops working the moment a relationship needs attributes. The notation cannot attach them, so the relationship must be promoted to an entity of its own, as in the artist-performs-song example that becomes an intersection entity for time and place.[2]
IDEF1X stops at the boundary of its own assumptions. Its original key-style language was defined for relational and extended relational databases, and a distinct identity-style language had to be added for object databases and object-oriented modelling.[5] Its key requirements, a designated primary key per entity and explicitly role-named foreign keys, are exactly what burden early conceptual work, when the structure is still being argued about.
UML drags in what a database diagram does not need, and gives up precision at the same time. Operations and object lifecycle have no relational meaning, and research cited in the ER literature found that a look-across notation such as UML's does not effectively represent participation constraints on relationships of degree higher than binary.[2]
None of these limits makes a notation wrong. Each states the job the notation was built for, and the defensible choice is the one whose job matches the readership in front of you.
Settling on one notation for your model
Pick one notation per readership and write the choice down where the team can see it: a note on the diagram, a line in the model's README, a sentence in the design guidelines. The written decision is what survives the person who made it.
Different audiences needing different views is not a notation problem, and switching notations is the wrong answer to it. The right answer is multiple diagrams: one design model can hold several diagrams, and the same table can appear in more than one of them, each with its own layout and its own set of tables.[10] A governance diagram and a developer diagram can sit side by side over the same schema, each cut for the room it is shown in. The database diagram tool page walks through that workflow in detail.
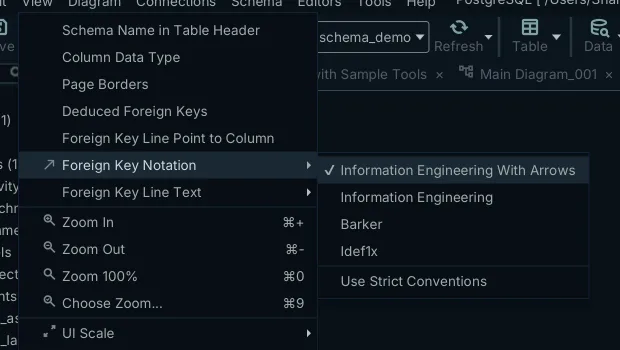
The notation itself is a rendering setting on the diagram, not a property of the model. In DbSchema it is switchable from the diagram's own menu, as the figures above show for Information Engineering, Barker and IDEF1X.[10] Changing the setting re-renders the same model; the model file and the database are unchanged, and nothing gets redrawn. You can try the choice against your readers instead of committing to it on paper.
If the schema already exists, start from it rather than from a blank canvas. Connect DbSchema to the database and it reverse-engineers the tables and foreign keys into a laid-out diagram, per engine, as in the MySQL ER diagram guide.
The cheapest way to settle the question is to look at one of your own schemas at real scale rather than at a textbook example with six tables. The free DbSchema Community Edition covers connecting, reverse-engineering, interactive diagrams and the SQL editor, which is enough to open one of your own schemas as a diagram, switch the notation, and see how it reads at real scale to the readers who have to decode it.
Frequently asked questions
What are the notations for an ER diagram?
The five families you will actually meet are Chen (relationships as labelled diamonds, attributes as ovals), crow's foot or Information Engineering (cardinality drawn on the line ends), Barker (the Oracle CASE style with dashed half-lines for optionality), IDEF1X (identifying versus non-identifying relationships), and UML class diagrams, which software teams often already read.
What is crow's foot notation?
A notation that draws entities as boxes and relationships as lines whose ends carry the cardinality: a ring means zero, a dash means one, and the crow's foot means many. Used in pairs, the inner symbol gives the minimum and the outer symbol the maximum, so a reader decodes the relationship without a legend. Its use dates back to a 1976 article by Gordon Everest.
What is the difference between Chen and crow's foot notation?
Chen draws relationships as diamonds and attributes as separate ovals connected to their entity, so each concept has its own shape and relationships can carry their own attributes. Crow's foot lists attributes inside the entity box and puts cardinality on the line ends. Chen is clearer for teaching the concepts; crow's foot is far more compact, which is why it survives on real schemas.
Which ER notation should a team use?
Whichever one its actual readers read best. For a mixed technical audience, crow's foot is the common default because cardinality and optionality are readable at the line end without a legend. A governance review may expect IDEF1X key discipline, and a software team that already reads UML class diagrams needs no second notation taught. Pick one and use it consistently; mixing notations inside a model costs more than any single choice.
What is Barker notation?
The ERD notation developed by Richard Barker and colleagues at the British consulting firm CACI around 1981 and later adopted by Oracle's CASE tools. It is a crow's foot variant that shows optionality as a dashed half-line on the relationship, and it adds constructs such as the exclusion arc and nested boxes for abstraction. It is valued for readability and efficient use of drawing space.
Can one model be shown in more than one notation?
Yes. In DbSchema the notation is a rendering setting on the diagram, so changing it re-renders the same design model rather than requiring a redraw, and the model file and the database are unchanged. One model can also hold several diagrams, with the same table appearing in more than one of them, so different audiences can each get a view drawn for them.
Sources
Open your own schema and switch the notation
DbSchema reverse-engineers a live database into an interactive ER diagram, and the foreign-key notation is a View setting you can change while you read it. The free Community Edition covers connecting, reverse-engineering, interactive diagrams and the SQL editor.