Create ER Diagrams for PostgreSQL with a Free Design Tool

Understanding a database starts with understanding its structure. For PostgreSQL users, one of the most effective ways to visualize and manage your schema is by using an Entity-Relationship Diagram (ERD). Whether you're working with a large legacy database or starting something new, an ER diagram shows how your tables are connected and how your data is organized.
In this article, I'm using DbSchema - a visual database design tool that’s free to use for creating diagrams.
You can also generate HTML5 documentation (up to 12 tables in the free version) and explore features like Git integration with a 15-day trial of the PRO edition.
We’ll cover two main workflows:
- Reverse engineer your existing PostgreSQL schema into an ER diagram
- Design a new schema from scratch
What Is an ER Diagram?
An ER diagram (Entity-Relationship diagram) shows how tables (entities) in a database relate to each other through foreign keys (relationships). It typically includes:
- Table names and columns
- Primary keys and foreign keys
- Relationships between tables
- Optional notes, indexes, and data types

An ER diagram helps:
- Understand and explain the structure of a database
- Identify missing relations or inconsistencies
- Onboard new team members faster
- Create technical documentation
- Keep track of schema changes in large systems
You can quickly understand how your tables are connected without digging through each one.
A good ER diagram doesn’t just show tables, it shows structure, logic, and it makes your schema easier to explain to others, whether they’re developers, analysts, or non-technical stakeholders.
What If You Already Have a Database?
If you’re working with an existing PostgreSQL database (or another relational database), you don’t need to create the diagram manually.
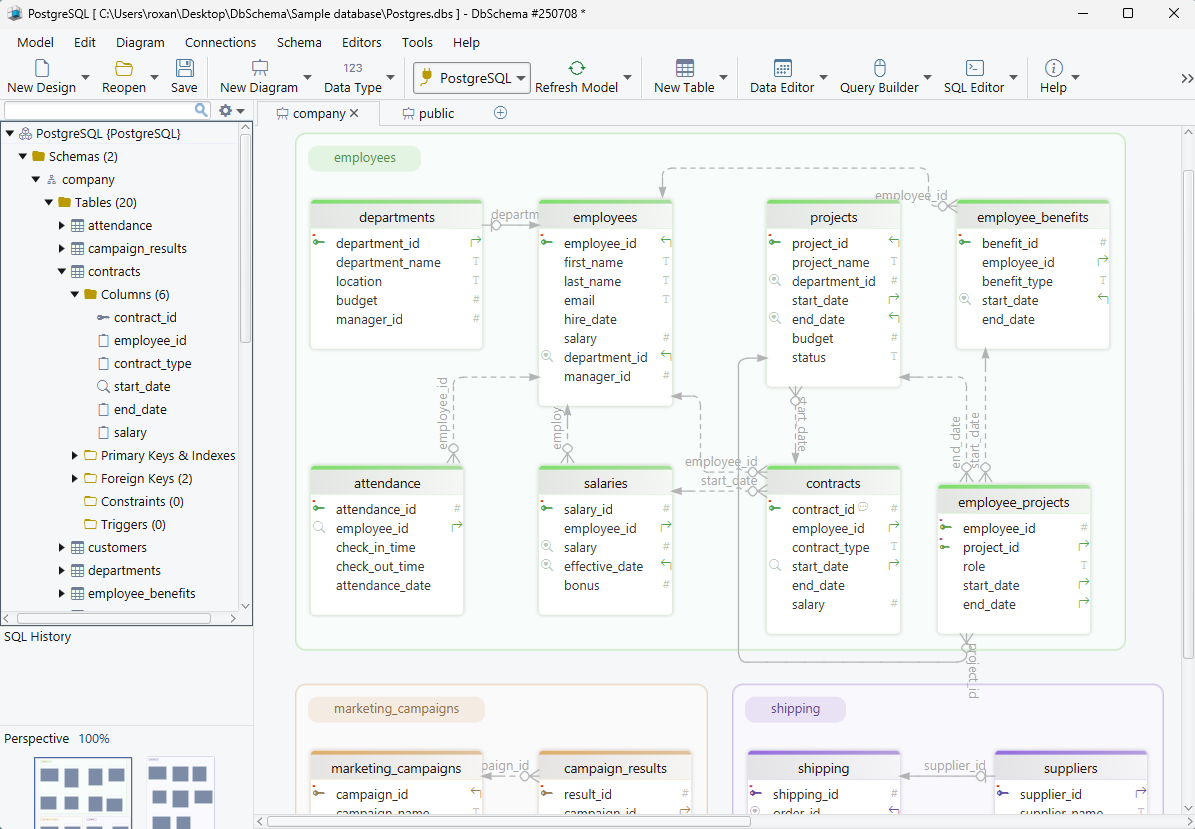
With this tool you can reverse engineer your database and generate the ER diagram automatically. It reads your schema, identifies tables and foreign keys, and builds a visual layout you can explore and edit.
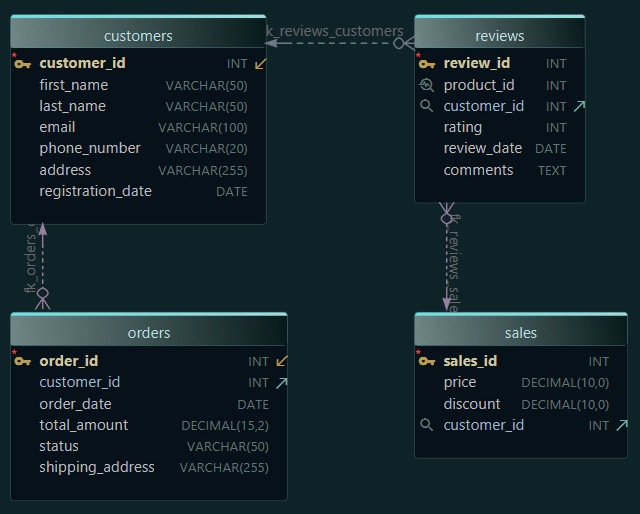
Here’s an example of a PostgreSQL schema visualized as an ER diagram:
Want to learn how to reverse engineer a PostgreSQL schema?
Read the documentation here
Visual Schema Design (Without Writing SQL)
Designing a database doesn’t have to start with CREATE TABLE.
Using a visual tool helps you build clean, connected structures without syntax errors.
- Click to add tables and columns
- Use forms to set types, keys, and constraints
- Drag to create relationships
- Spot design issues before writing any SQL
When you're done, generate the SQL automatically.
Learn how to design a schema visually
What Else Can You Do with Your ER Diagram?
An ER diagram isn’t just something you generate once and forget. In DbSchema, it becomes a real workspace where you can organize, edit, track, and share your database structure.
Here’s what that means:
Use Multiple Diagrams to Stay Organized
Big databases are hard to follow in a single layout. DbSchema lets you split your schema into multiple diagrams - for example, one for user data, another for inventory, and so on.
This keeps things readable and makes it easier to focus on specific areas.
Keep the Diagram in Sync with the Database
Schemas change - columns are added, constraints removed. With the Schema Compare feature helps you spot the differences between your diagram and the live database.
You can choose whether to update the diagram or the database, based on what’s changed.

Version Your Diagram with Git
Your diagram is saved in a project file you can commit to Git. That means you can track changes, collaborate with teammates, and roll back if needed,f just like you do with code.

Share It as Interactive Documentation
Need to show the schema to someone who doesn’t know how to work with databases?
You can export it as HTML5 documentation with clickable tables, columns, and comments.
It runs in any browser and doesn’t require installing anything. Also, you can save it as an SVG image, which is interactive and has a low size.

Your ER diagram doesn’t have to be just a picture. In DbSchema, it becomes a tool you can maintain, track, and share throughout your entire project.
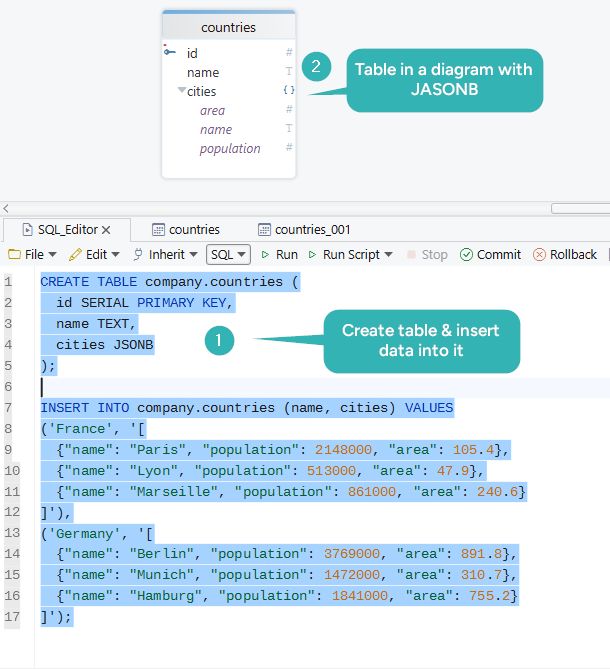
Working with PostgreSQL’s JSONB columns visually
PostgreSQL’s jsonb data type is a powerful way to store flexible, semi-structured data, especially when your records don’t always follow a strict format. But querying jsonb fields can get complex fast, with operators like ->, ->>, and #>> cluttering your SQL.
DbSchema simplifies this by allowing you to explore and query jsonb columns visually, using its built-in Query Builder.
You can:
- View
jsonbdata in a table format, right from the data explorer - Build complex queries that extract keys, values, or nested structures
- Filter and sort results without manually writing SQL
- Use expressions and conditions on
jsonbfields just like normal columns
Read more about JSONB in this article
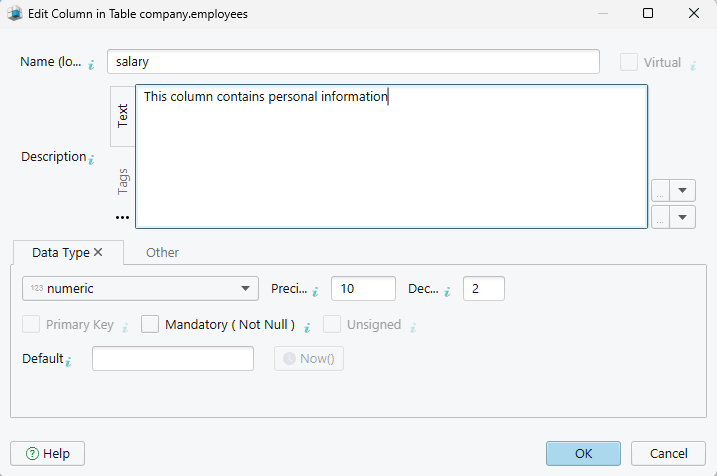
Add Notes to Explain the Model
You can add notes or comments directly to tables, columns, or relationships.
This helps others understand your design choices, and the notes will also appear in the generated documentation.
You can even use tags in your tables, which can be picked up later in automation scripts or deployment tools.
Export for Reporting or Deployment
When it’s time to share your work or move to production, this tool gives you flexible export options:
- Images (PNG, PDF) - Ideal for presentations, reports, or documentation
- SQL Scripts - Generate
CREATE TABLE,ALTER, and other scripts for deployment - Interactive HTML5 - Share a clickable version of your schema with teams or clients
These options make it easy to document the schema in the right format for any audience, technical or not.
Benefits of Using DbSchema for PostgreSQL ER Diagrams
| Feature | Description |
|---|---|
| Free Version Available | No need for a license to use core features |
| Visual Interface | No SQL required for designing or viewing schemas |
| Offline and Secure | Work locally, with or without a live database connection |
| Schema Synchronization | Keep diagrams and databases in sync |
| HTML5 Documentation | Generate browsable docs in seconds |
| Version Control | Git integration for team-based design |
| Supports Other Databases | Use the same tool for MySQL, Oracle, SQL Server, and more |
Conclusion
Designing your PostgreSQL schema visually makes everything easier - from understanding complex relationships to avoiding structural mistakes early on.
It’s also a huge help when working in teams or documenting your work for others.
Whether you’re starting from scratch or improving an existing design, using diagrams and comments gives you a clearer picture of your database and how everything fits together.
All of this in a free, visual, and easy-to-use environment.
To get started, download DbSchema for free!
And if you want to learn more about PostgreSQL integrations and how a visual tool works with it, visit our official documentation.