SQL Aggregate Functions – COUNT, SUM, AVG, MIN, MAX, and GROUP BY | DbSchema
Table of Contents
- What aggregate functions are
- Sample table
- MIN() and MAX()
- COUNT()
- SUM()
- AVG()
- Combine multiple aggregate functions
- GROUP BY with aggregate functions
- FILTER clause
- Conditional aggregation with CASE
- Aggregate functions vs window functions
- ROLLUP – subtotals per group
- CUBE – all group combinations
- GROUPING SETS – custom grouping levels
- NULL handling in aggregate functions
- Common mistakes and performance tips
- Use aggregate functions in DbSchema
- FAQ
- Conclusion
SQL aggregate functions collapse many rows into a smaller set of summary values. They are the foundation of reporting, dashboards, analytics, health checks, and finance queries.
This guide covers the full family: MIN(), MAX(), COUNT(), SUM(), and AVG(), plus GROUP BY, HAVING, FILTER, ROLLUP, CUBE, and GROUPING SETS. If you only need a narrower walkthrough of the most common three functions, see SQL COUNT, AVG, and SUM Functions.
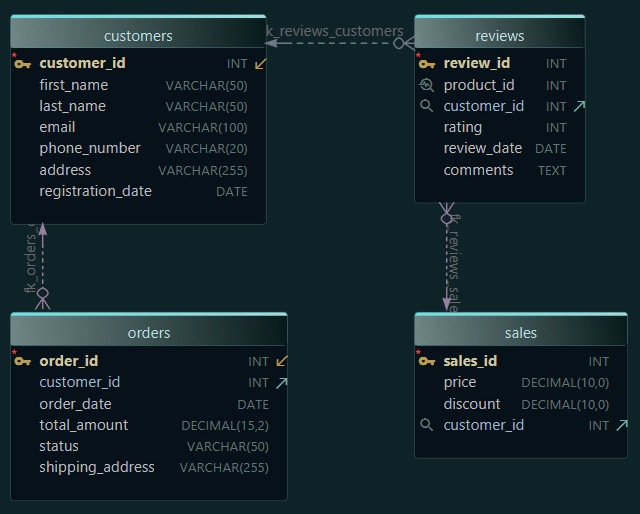
DbSchema is a practical place to test these queries because you can inspect the schema, preview the data, and compare grouped output without leaving the same workspace.
What aggregate functions are
An aggregate function takes a set of rows and produces one value per group. Without GROUP BY, the entire result set is treated as one group.
| Function | What it returns | Common use case |
|---|---|---|
MIN(col) | smallest value | earliest date, lowest price |
MAX(col) | largest value | latest date, highest score |
COUNT(*) | number of rows | row count, completeness checks |
COUNT(col) | non-NULL values | optional field completeness |
SUM(col) | total of numeric values | revenue, quantity, time spent |
AVG(col) | average of numeric values | mean salary, average rating |
Sample table
CREATE TABLE sales (
    sale_id    INT,
    region     VARCHAR(50),
    product    VARCHAR(50),
    amount     DECIMAL(10, 2),
    sale_date  DATE
);

INSERT INTO sales VALUES
    (1, 'North', 'Widget',  120.00, '2025-01-10'),
    (2, 'South', 'Gadget',  200.00, '2025-01-15'),
    (3, 'North', 'Gadget',  180.00, '2025-02-01'),
    (4, 'East',  'Widget',   90.00, '2025-02-14'),
    (5, 'South', 'Widget',  150.00, '2025-03-05'),
    (6, 'North', NULL,       NULL,  '2025-03-12');
We will reuse this table throughout the article so the results stay easy to compare.
MIN() and MAX()
MIN() and MAX() work on any orderable type: numbers, dates, and text.
SELECT
    MIN(amount)     AS lowest_sale,
    MAX(amount)     AS highest_sale,
    MIN(sale_date)  AS first_sale,
    MAX(sale_date)  AS latest_sale
FROM sales;
| lowest_sale | highest_sale | first_sale | latest_sale |
|---|---|---|---|
| 90.00 | 200.00 | 2025-01-10 | 2025-03-12 |
Both functions ignore NULL values.
MIN/MAX per group
SELECT region,
       MIN(amount) AS min_sale,
       MAX(amount) AS max_sale
FROM sales
WHERE amount IS NOT NULL
GROUP BY region
ORDER BY region;
COUNT()
COUNT(*) counts all rows. COUNT(column) counts only non-NULL values.
SELECT
    COUNT(*)       AS total_rows,
    COUNT(amount)  AS rows_with_amount,
    COUNT(product) AS rows_with_product
FROM sales;
| total_rows | rows_with_amount | rows_with_product |
|---|---|---|
| 6 | 5 | 5 |
Use COUNT(DISTINCT column) when you need unique values:
SELECT COUNT(DISTINCT region) AS unique_regions
FROM sales;
SUM()
SUM() adds numeric values, skipping NULL.
SELECT
    region,
    SUM(amount) AS total_sales
FROM sales
GROUP BY region
ORDER BY total_sales DESC;
This pattern appears in revenue reports, order summaries, stock movement, and time tracking.
AVG()
AVG() divides the sum by the count of non-NULL values:
SELECT
    region,
    ROUND(AVG(amount), 2) AS average_sale
FROM sales
WHERE amount IS NOT NULL
GROUP BY region;
Use AVG() carefully when missing values are meaningful. If you replace NULL with 0, the result means something different.
Combine multiple aggregate functions
In real reporting queries, analysts usually combine several aggregates:
SELECT
    region,
    COUNT(*)              AS orders,
    MIN(amount)           AS min_sale,
    MAX(amount)           AS max_sale,
    SUM(amount)           AS total,
    ROUND(AVG(amount), 2) AS average
FROM sales
WHERE amount IS NOT NULL
GROUP BY region
ORDER BY total DESC;
That one query gives row count, range, total, and average in a single pass.
GROUP BY with aggregate functions
GROUP BY splits rows into groups before aggregation. Every non-aggregate column in SELECT must also appear in GROUP BY.
SELECT region, product, SUM(amount) AS total
FROM sales
WHERE amount IS NOT NULL
GROUP BY region, product
ORDER BY region, product;
To filter grouped results, use HAVING:
SELECT region, SUM(amount) AS total
FROM sales
WHERE amount IS NOT NULL
GROUP BY region
HAVING SUM(amount) > 100
ORDER BY total DESC;
For deeper walkthroughs, see SQL GROUP BY Explained and SQL HAVING Clause.
FILTER clause
The FILTER clause applies a condition to one aggregate without forcing a subquery:
SELECT
    SUM(amount)                                 AS total_all,
    SUM(amount) FILTER (WHERE region = 'North') AS total_north,
    COUNT(*) FILTER (WHERE amount > 150)        AS high_value_orders
FROM sales;
This is cleaner than packing multiple CASE expressions into a single query when your database supports it.
Conditional aggregation with CASE
When you need portable SQL across more databases, conditional aggregation with CASE is the classic pattern:
SELECT
    SUM(CASE WHEN region = 'North' THEN amount ELSE 0 END) AS north_total,
    SUM(CASE WHEN region = 'South' THEN amount ELSE 0 END) AS south_total,
    COUNT(CASE WHEN amount >= 150 THEN 1 END)              AS high_value_orders
FROM sales;
This is common in KPI dashboards because it returns several metrics in one grouped query.
Aggregate functions vs window functions
Regular aggregate functions reduce the number of rows. Window functions keep the detail rows and add a summary beside them.
SELECT
    sale_id,
    region,
    amount,
    SUM(amount) OVER (PARTITION BY region) AS region_total
FROM sales
WHERE amount IS NOT NULL;
Use grouped aggregates when you want one row per group. Use window functions when you want every row plus a comparison metric. For more on that pattern, see Window Functions in SQL.
ROLLUP – subtotals per group
ROLLUP generates subtotals at each level of the grouping hierarchy plus a grand total:
SELECT
    region,
    product,
    SUM(amount) AS total
FROM sales
WHERE amount IS NOT NULL
GROUP BY ROLLUP(region, product)
ORDER BY region, product;
The result includes:
- one row per
(region, product) - one subtotal row per
region - one grand total row
CUBE – all group combinations
CUBE generates subtotals for every possible subset of the grouping columns:
SELECT
    region,
    product,
    SUM(amount) AS total
FROM sales
WHERE amount IS NOT NULL
GROUP BY CUBE(region, product)
ORDER BY region, product;
For two grouping columns, CUBE produces (region, product), (region), (product), and () for the grand total.
GROUPING SETS – custom grouping levels
GROUPING SETS lets you specify exactly which grouping combinations to include:
SELECT
    region,
    product,
    SUM(amount) AS total
FROM sales
WHERE amount IS NOT NULL
GROUP BY GROUPING SETS (
    (region, product),
    (region),
    ()
)
ORDER BY region, product;
This is useful when ROLLUP is too broad and you want only a few summary levels.
NULL handling in aggregate functions
All five core aggregate functions skip NULL values in their computation, except COUNT(*).
| Function | Skips NULL? |
|---|---|
COUNT(*) | No |
COUNT(col) | Yes |
MIN(col) | Yes |
MAX(col) | Yes |
SUM(col) | Yes |
AVG(col) | Yes |
Use COALESCE only when replacing NULL reflects the business meaning you want:
SELECT AVG(COALESCE(amount, 0)) AS avg_including_missing
FROM sales;
If you need a refresher on nullable logic, see SQL NULL Values.
Common mistakes and performance tips
Common mistakes
- using
HAVINGwhen aWHEREfilter would be cheaper - forgetting to group every non-aggregate column
- confusing
COUNT(*)withCOUNT(column) - treating
NULLas zero without checking the business meaning - mixing grouped aggregates and detail columns accidentally
Practical performance tips
- push row-level filters into
WHEREbefore grouping - add indexes for join and filter columns, not for the aggregate expression itself
- preview grouped outputs in DbSchema before turning a draft into application code
If you need focused examples on COUNT(), AVG(), and SUM(), go to SQL COUNT, AVG, and SUM Functions.
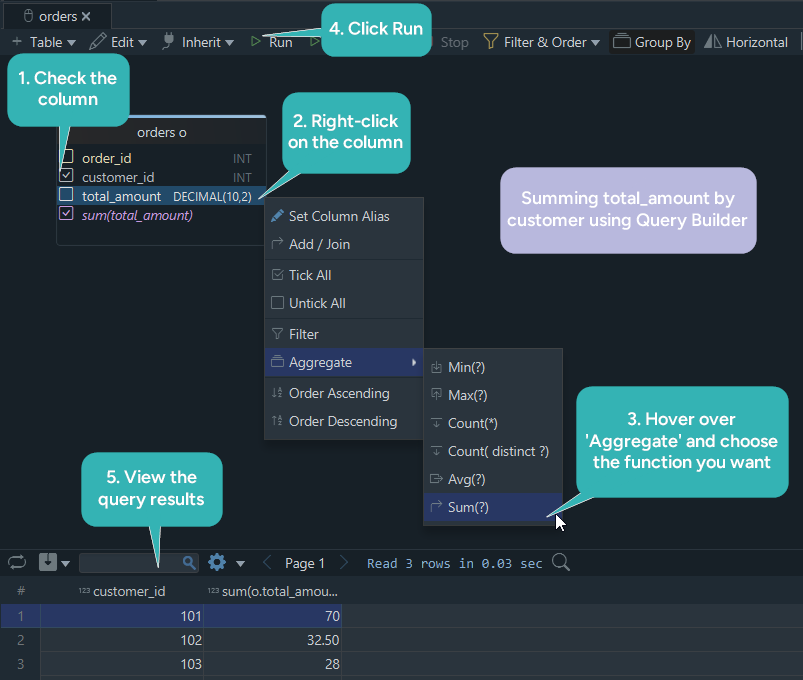
Use aggregate functions in DbSchema
DbSchema's visual Query Builder makes aggregate queries easier to prototype and explain.
- Connect to your database using the PostgreSQL JDBC driver or MySQL JDBC driver
- Open the Query Builder and drag tables into the editor
- Choose grouped columns and apply
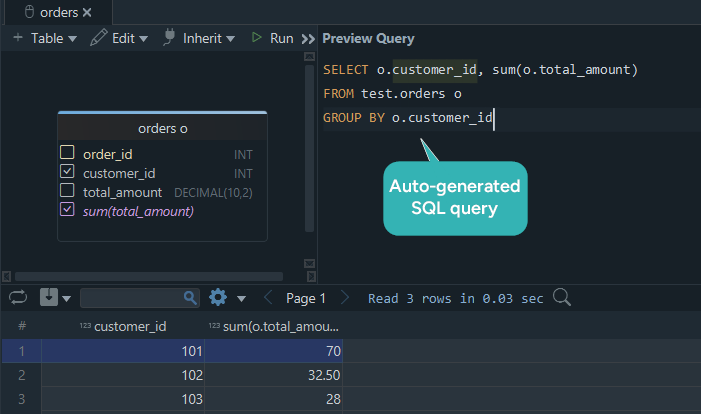
SUM(),AVG(),MIN(),MAX(), orCOUNT() - Review the generated SQL and run it in the SQL Editor
- Save the query and include it in shared schema documentation
That workflow is especially useful when you are validating reports with teammates who want to see both the schema and the query.
FAQ
What is the difference between COUNT(*) and COUNT(column)?
COUNT(*) counts every row. COUNT(column) counts only rows where that column is not NULL.
Do aggregate functions ignore NULL?
All aggregate functions except COUNT(*) ignore NULL values.
What is the difference between WHERE and HAVING?
WHERE filters rows before grouping. HAVING filters groups after aggregation.
Can I use an aggregate function without GROUP BY?
Yes. Without GROUP BY, the whole result set is treated as one group.
Why does SQL say a column must appear in the GROUP BY clause?
Because a non-aggregate column in SELECT must have one value per group. Add it to GROUP BY or wrap it in an aggregate function.
What is ROLLUP used for?
ROLLUP creates subtotal rows and a grand total, which is useful for reports and dashboards.
Conclusion
SQL aggregate functions are the building blocks of every summary query. Once you understand COUNT(), SUM(), AVG(), MIN(), MAX(), and how they interact with GROUP BY, HAVING, ROLLUP, and NULL, you can write much stronger analytical SQL.
Use DbSchema to build aggregate queries visually, inspect the live tables behind them, and share the resulting documentation with your team.