SQL GROUP BY Explained with Examples

When you work with databases, you often want summaries instead of just raw rows.
- How many orders did each customer make?
- What are the total sales per department?
- What is the average grade per student?
This is where SQL GROUP BY comes in.
It allows you to group rows that share the same value and then apply functions like COUNT(), SUM(), or AVG().
What You’ll Learn
In this guide, we’ll cover the main GROUP BY functions step by step:
- COUNT() - Count number of rows
- SUM() - Add up values
- AVG() - Calculate averages
- HAVING - Filter grouped results
- JOIN - Use names instead of IDs
- MIN() - Find the smallest value
- MAX() - Find the largest value
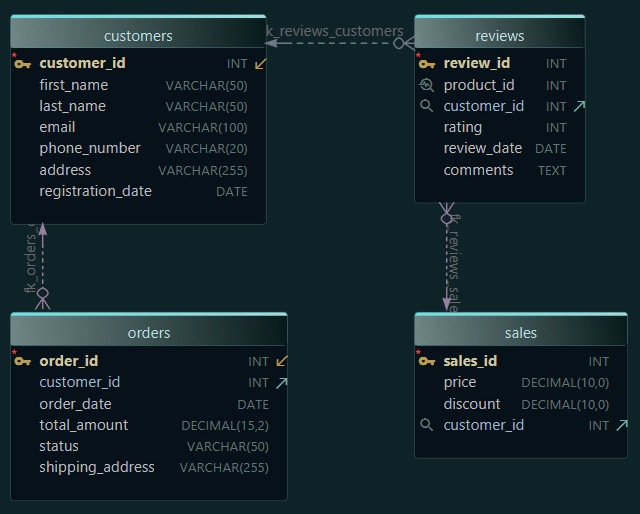
Example Tables
Let’s use a simple shop database with customers and their orders.
| order_id | customer_id | product | total_amount |
|---|---|---|---|
| 101 | 1 | Bread | 50 |
| 102 | 2 | Milk | 30 |
| 103 | 1 | Oranges | 70 |
| 104 | 2 | Cheese | 40 |
| 105 | 3 | Apples | 20 |
| customer_id | total_spent |
|---|---|
| 1 | 120 |
| 2 | 70 |
| 3 | 20 |
GROUP BY with COUNT
Count how many orders each customer has placed.

SELECT customer_id, COUNT(*) AS order_count
FROM Orders
GROUP BY customer_id;| customer_id | order_count |
|---|---|
| 1 | 2 |
| 2 | 2 |
| 3 | 1 |
Each customer_id is grouped, and the number of orders is counted.
GROUP BY with SUM
Now, let’s find the total spending of each customer.

SELECT customer_id, SUM(total_amount) AS total_spent
FROM Orders
GROUP BY customer_id;| customer_id | total_spent |
|---|---|
| 1 | 120 |
| 2 | 70 |
| 3 | 20 |
Each customer_id is grouped, and the SUM(total_amount) gives the total money they spent.
Customers Table
To make our reports more readable, let’s also create a Customers table with names for each customer:
| customer_id | name |
|---|---|
| 1 | Sarah James |
| 2 | Mark White |
| 3 | Olivia Reed |
This table can be joined with Orders using customer_id.
From now on, we’ll use JOINs so results will display names instead of IDs.
GROUP BY with AVG
You can also compute the average order value per customer (showing names via JOIN).
SELECT c.name, AVG(o.total_amount) AS avg_order
FROM Customers c
JOIN Orders o ON c.customer_id = o.customer_id
GROUP BY c.name;| name | avg_order |
|---|---|
| Sarah James | 60 |
| Mark White | 35 |
| Olivia Reed | 20 |
Sarah placed two orders worth 50 and 70 → the average is 60.
GROUP BY with HAVING
Sometimes, you want to filter after grouping.
This is where HAVING comes in (not WHERE).

SELECT c.name, SUM(o.total_amount) AS total_spent
FROM Customers c
JOIN Orders o ON c.customer_id = o.customer_id
GROUP BY c.name
HAVING SUM(o.total_amount) > 50;| name | total_spent |
|---|---|
| Sarah James | 120 |
| Mark White | 70 |
Only customers with spending over 50 are included.
GROUP BY with JOIN
JOIN helps you show labels instead of IDs in grouped results.

SELECT c.name, SUM(o.total_amount) AS total_spent
FROM Customers c
JOIN Orders o ON c.customer_id = o.customer_id
GROUP BY c.name;| name | total_spent |
|---|---|
| Sarah James | 120 |
| Mark White | 70 |
| Olivia Reed | 20 |
Use JOIN whenever you want readable names in your reports.
GROUP BY with MIN
Find the smallest order amount per customer (names via JOIN).

SELECT c.name, MIN(o.total_amount) AS min_order
FROM Customers c
JOIN Orders o ON c.customer_id = o.customer_id
GROUP BY c.name;| name | min_order |
|---|---|
| Sarah James | 50 |
| Mark White | 30 |
| Olivia Reed | 20 |
This returns the lowest order amount for each customer.
GROUP BY with MAX
Find the largest order amount per customer (names via JOIN).

SELECT c.name, MAX(o.total_amount) AS max_order
FROM Customers c
JOIN Orders o ON c.customer_id = o.customer_id
GROUP BY c.name;Result:
| name | max_order |
|---|---|
| Sarah James | 70 |
| Mark White | 40 |
| Olivia Reed | 20 |
This returns the highest order amount for each customer.
How to Do This Visually in DbSchema
With DbSchema, you don’t need to type SQL from scratch - you can build GROUP BY queries visually in the Query Builder:
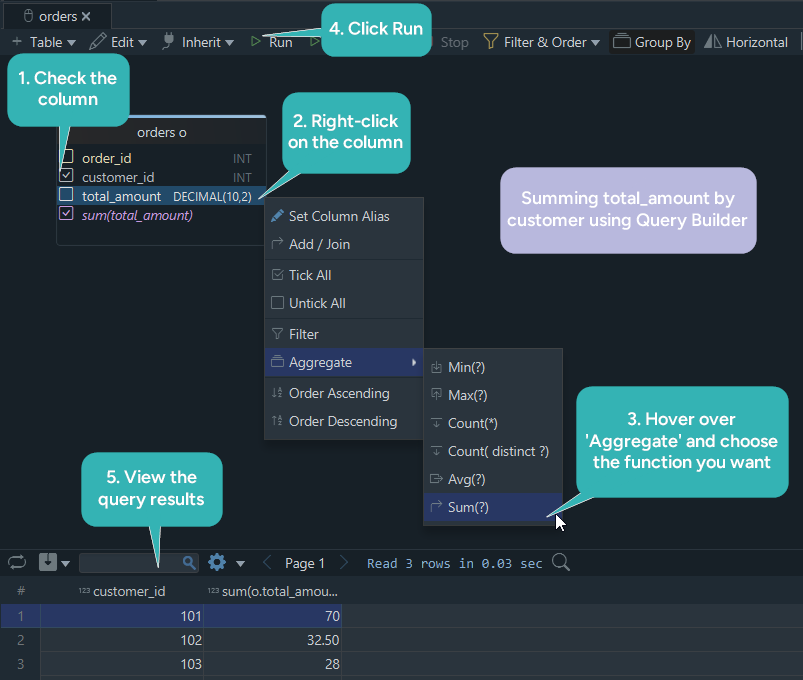
- Drag your tables (Customers and Orders) into the canvas.
- Connect them by their foreign key.
- Select the columns you want to display (e.g.,
name). - Right-click on a numeric column (like
total_amount). - Choose Aggregate → SUM, COUNT, AVG, MIN, MAX.
DbSchema automatically adds the GROUP BY for you and shows the generated SQL alongside the diagram.
This makes it much easier to learn SQL because you see both the visual structure and the query code at the same time.
Summary
GROUP BYgroups rows with the same value.- Combine with
COUNT,SUM,AVG,MIN,MAXto summarize data. - Use
HAVINGto filter groups after aggregation. - Perfect for totals, averages, and category-based reports.
Learn More
Check out more SQL tutorials here: