How to Create ER Diagrams for SQLite with a Free Tool

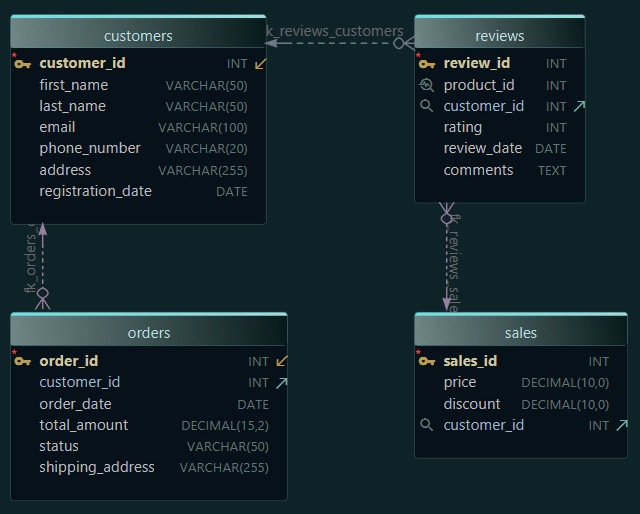
If you're working with a SQLite database, one of the best ways to understand how it's built is to look at it visually - with an ER diagram (Entity-Relationship Diagram).
An ER diagram shows how tables are connected, what fields they have, and how data flows between them.
In this article, we’ll use DbSchema, a tool that lets you design and explore your database without writing code.
You can:
- Open your existing SQLite database and turn it into a diagram
- Or design a new schema from scratch
What Is an ER Diagram?
An ER diagram is a visual map of your database. It shows:
- Tables and their columns
- Primary keys and foreign keys
- Relationships between tables
- Column types, indexes, and optional comments

Why it helps:
- You understand the structure much faster
- It’s easier to spot problems or missing links
- Great for explaining the database to others
- Useful when working in teams or documenting your work
Already Have a SQLite Database?
If you already have a .db file, you can load it in DbSchema and generate the diagram instantly.
The tool reads the tables and their connections, then creates a layout you can adjust and edit.

Need help connecting to SQLite? Here’s a quick tutorial
Want to Build an ERD from Scratch?
You don’t need to write any SQL. You can design the database by dragging and clicking:
- Add new tables and fields
- Set data types, primary keys, and other constraints
- Draw lines to create relationships
- Catch design mistakes early, before they turn into real problems
Once you're done, DbSchema can generate the full SQL script for you.
Read the article: How to design a schema visually or watch the video tutorial How to Design a Database: Conceptual, Logical & Physical Explained
What You Can Do with Your Diagram
An ER diagram isn’t just something you generate once and forget. In DbSchema, it becomes a real workspace where you can organize, edit, track, and share your database structure.
Here’s what that means:
Use Multiple Diagrams
Big databases can be hard to follow in one view. You can split your schema into multiple diagrams, like one for users and another for orders.
This makes it easier to focus on smaller sections.
Generate Interactive Documentation
Need to generate documentation to show your schema to a colleague or client?
You can export it as:
- Interactive HTML5 docs - works in any browser
- PNG or SVG images - for presentations or reports
- SQL scripts - to recreate the database
- PDF or Markdown - for offline use

***Note: In the Community Edition you can export a maximum of 12 tables; for unlimited tables and diagrams use the PRO Edition.
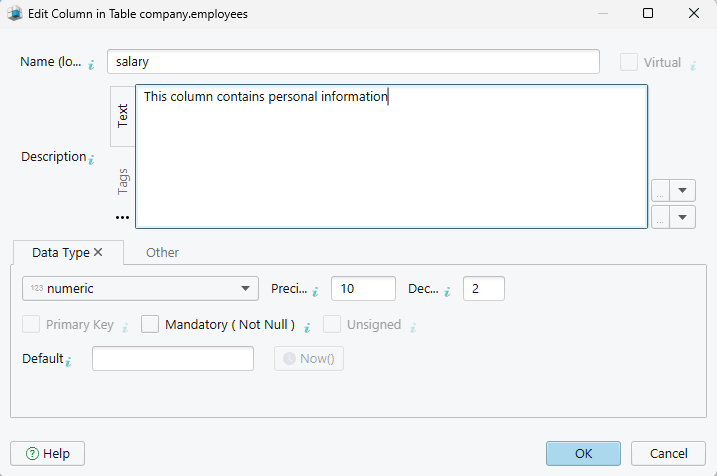
Add Comments and Notes
You can write notes directly on tables or columns.
This helps explain your decisions and makes it easier for others to follow.
These comments also show up in the documentation.
You can use the following features available in the PRO Edition with a 30-day Free trial.
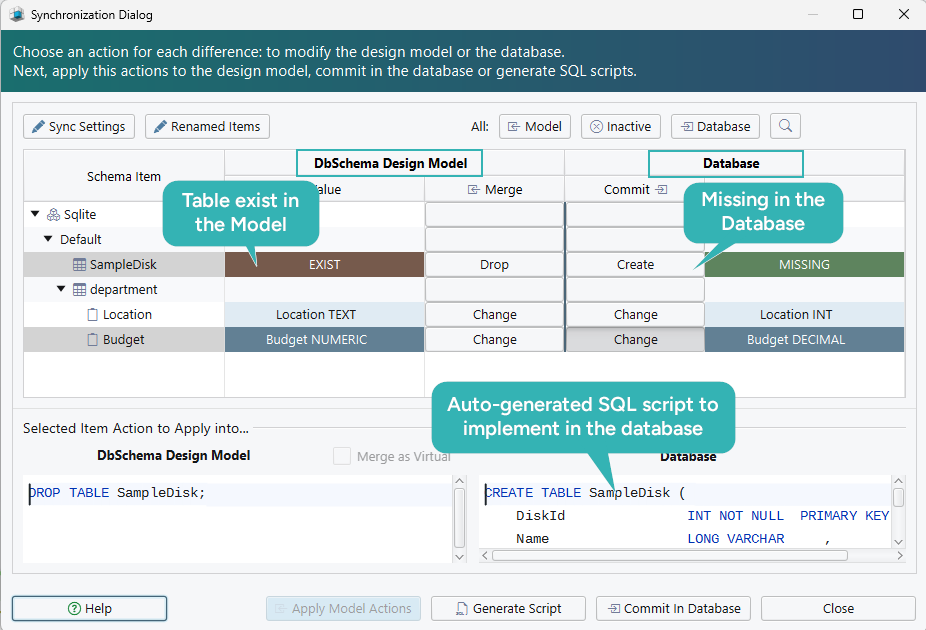
Keep the Schema in Sync
Your database changes over time. Use the Schema Synchronization to compare the diagram with the live database and see what’s different.
You can update either side - the diagram or the database, depending on what changed.
Save the Model and Use Git
Your diagram is saved in a project file, which is an XML file that can be edited with any text editor. You can put it in any Git repository like your code.
This means you can track changes, share with your team, and roll back if needed.

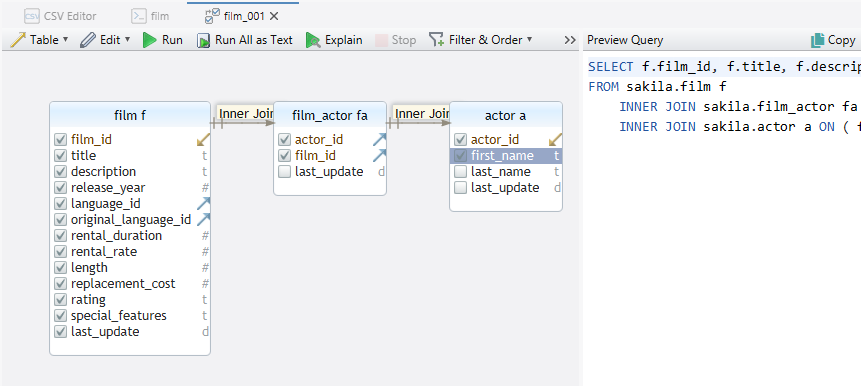
Visual Query Builder
Build SQL Queries visually without having to write any line of code. Add and edit tables with a simple click.
-
Join Following the Foreign Keys Join tables following normal or virtual foreign keys.
-
Join Clauses Choose between LEFT, OUTER and EXISTS joins
-
Group By Conditions Make use of COUNT(*), AVG(), SUM()
-
Where Filters Set filters on columns
Why Use DbSchema for SQLite?
| Feature | What It Does |
|---|---|
| Free version available | Create diagrams without needing a license |
| Visual editor | Build and edit schemas without writing SQL |
| Works offline | No need for internet or a running server |
| Diagram sync | Keep model and database up to date |
| HTML5 documentation | Export clickable, shareable docs in seconds |
| Git integration | Track schema changes with your code |
| Multi-database support | Works with SQLite, MySQL, PostgreSQL, and more |
Wrapping Up
Trying to understand a database just by reading table definitions can be overwhelming.
An ER diagram gives you the full picture - how everything connects, what’s missing, and where things can improve.
If you're working with SQLite, designing or exploring your schema visually can save hours of confusion.
It's easier to spot mistakes, explain your work, and keep everything organized.
DbSchema makes all of this simple - no coding needed.
Download it for free and see how your SQLite project looks in a diagram.
Need extra guidance? Read the official SQLite docs