Turn InfluxDB Measurements into Visual Schema Diagrams
DbSchema gives InfluxDB teams a design-first workflow: import the existing schema as an interactive ER diagram, refine it visually, and ship every change as a reviewed SQL script.
Built for visual modeling, schema documentation, and deployment, with an offline model you can keep in Git, team collaboration, and documentation that developers, analysts, and stakeholders can navigate in minutes.

Download DbSchema See InfluxDB Features Download InfluxDB JDBC Driver · All drivers
What happens after you download?
Get to your first InfluxDB schema diagram in minutes. No account, no credit card.
Install in minutes
Download the installer for Windows, macOS, or Linux and launch DbSchema. No signup required.
Connect to InfluxDB or open a sample
Reverse engineer an existing InfluxDB database or open a sample model to explore tables, relationships, and indexes.
Design, document, and deploy
Edit schema visually, generate documentation, and prepare reviewed migration scripts for safer releases.
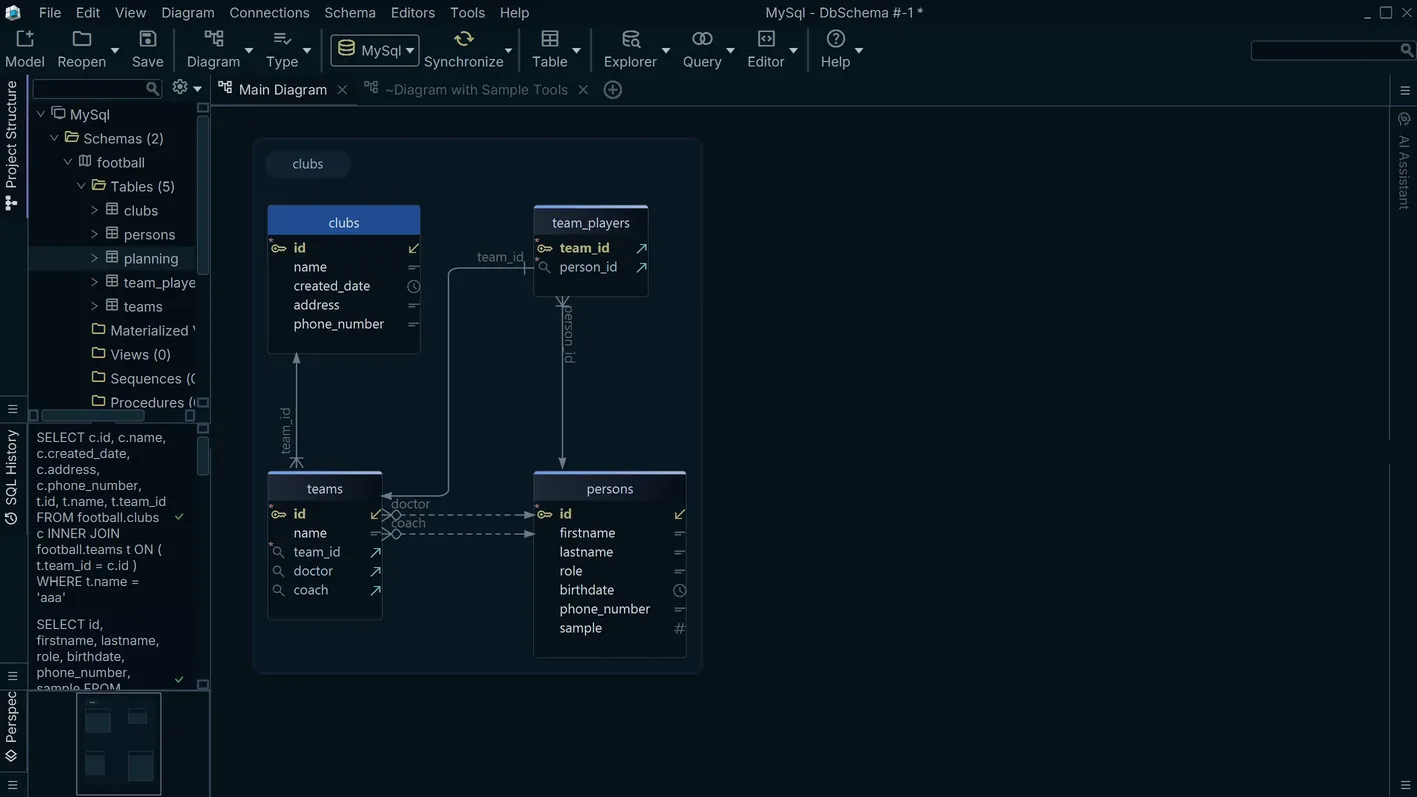
InfluxDB organizes time-series data into measurements, each containing tag keys (indexed metadata strings), field keys (the measured numeric or string values), and a timestamp. This model differs fundamentally from relational schemas — there is no DDL defining columns, and the tag-and-field set is inferred from the data as it is written. DbSchema maps each measurement as a table, exposes tag keys and field types in the diagram view, and supports SQL-compatible queries for InfluxDB 3.x as well as connections to InfluxDB 2.x instances.
Write and Execute SQL Queries Against Time-Series Measurements
InfluxDB 3.x exposes a SQL interface via Arrow Flight SQL, and DbSchema's SQL editor connects
to it directly. Write time-bounded SELECT statements, aggregate by tag keys, and apply
InfluxDB SQL functions such as date_bin — all without switching to a separate
client or the InfluxDB web UI.
Download DbSchema Free See InfluxDB Features
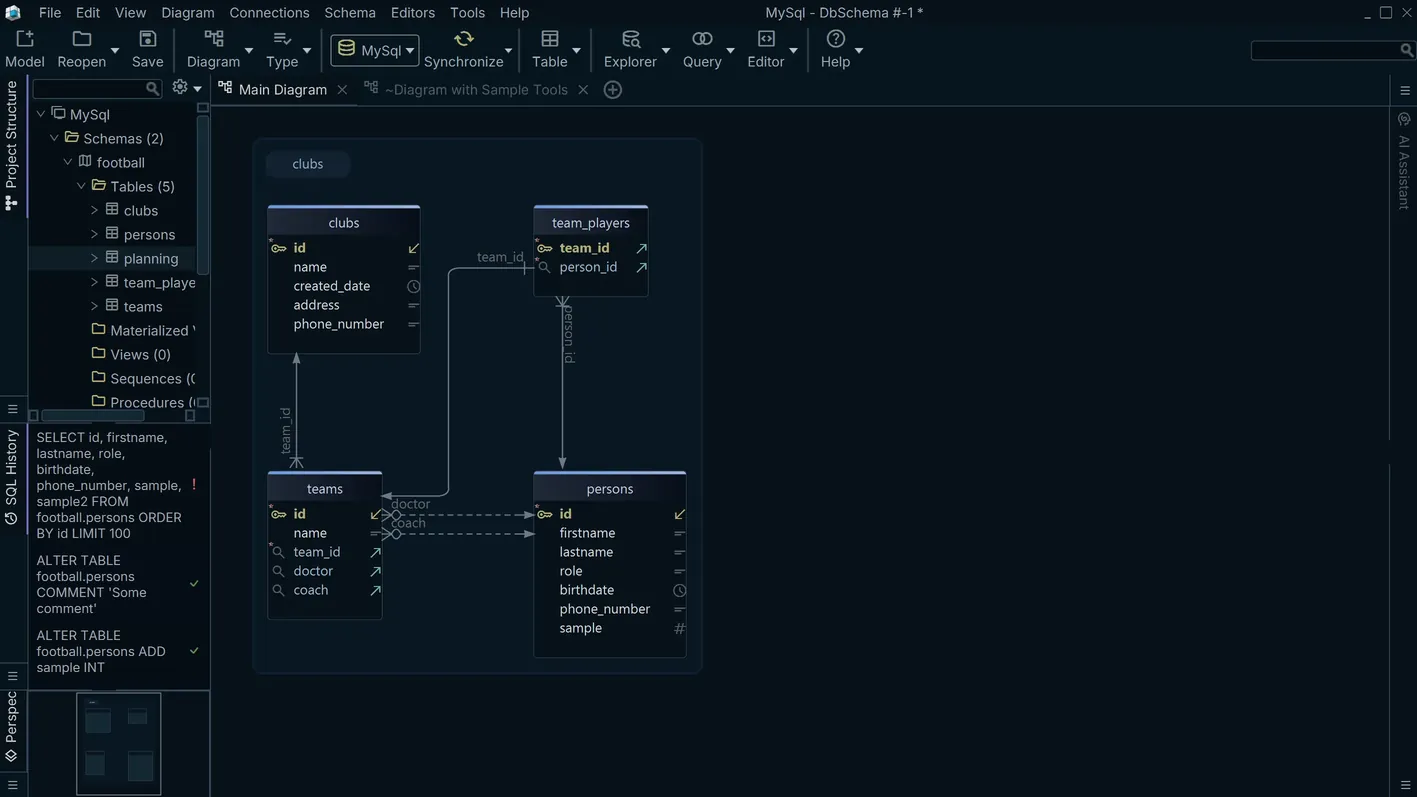
Browse Time-Series Data Row by Row
The data explorer renders measurement query results in a paginated grid. Filter by time range and tag values to narrow down the result set and inspect individual data points — useful for validating ingestion pipelines or tracing unexpected values back to their source.
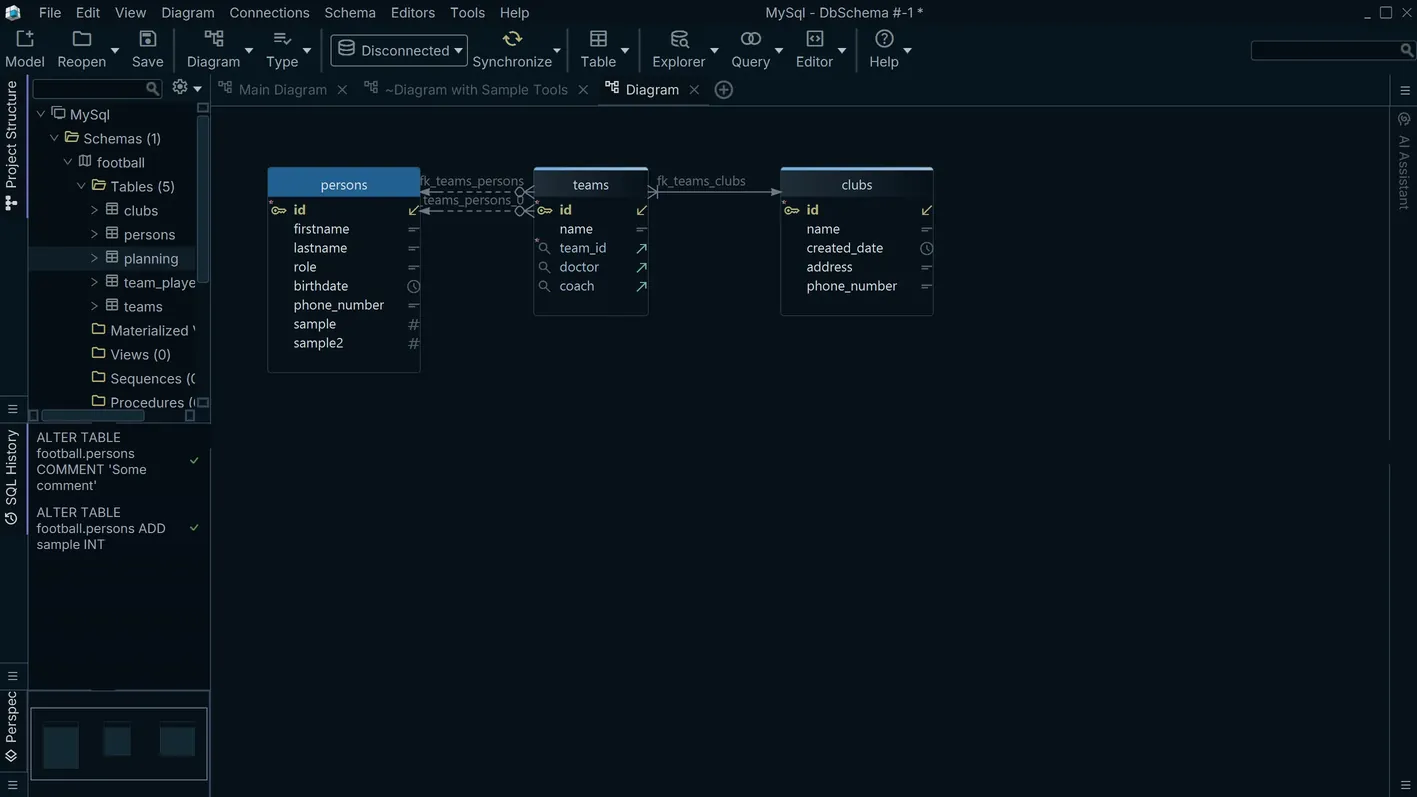
Document Measurement Schemas for Downstream Consumers
DbSchema auto-generates HTML schema documentation from the inferred measurement structure, covering tag keys, field types, and any manually defined relationships between measurements. Share this documentation with teams consuming your time-series data via Grafana, Telegraf, or custom clients so they know exactly which fields to expect.
How to Connect DbSchema to InfluxDB
Connection details differ by InfluxDB generation, but the DbSchema setup follows the same steps either way:
- Install DbSchema, then start a new connection and select InfluxDB.
- Add the driver: DbSchema provides an open-source InfluxDB JDBC driver, with source code available on GitHub; an Arrow Flight JDBC driver also works for 3.x.
- Generate an API token in the InfluxDB UI under Load Data → API Tokens before configuring the connection.
- For InfluxDB 3.x (InfluxDB Cloud Serverless and InfluxDB 3 Core), connect over Arrow Flight SQL
on port 443, supplying the API token as the password field and leaving the username blank or
set to
token. For self-hosted InfluxDB 2.x, connect to the HTTP API on port 8086 using a 2.x-compatible JDBC driver or the Flux HTTP interface. - Connect — DbSchema maps each measurement to a table and shows tag keys and field types in the diagram.
Why Use DbSchema with InfluxDB
- Map measurements, tag keys, and field types into a visual schema diagram
- Run SQL queries against InfluxDB 3.x measurements with time-range predicates
- Page through raw data points without writing a dedicated query client
- Auto-document measurement schemas for consumers of your time-series platform
- Compare measurement structures across InfluxDB buckets to find naming inconsistencies
Need a schema view of measurements that have no formal DDL? Download DbSchema for free and map your InfluxDB tag keys and field types visually in minutes.
Related databases
Teams working with InfluxDB often use these engines too. Explore dedicated guides and JDBC setup for each.